Forecast agreement on day 154
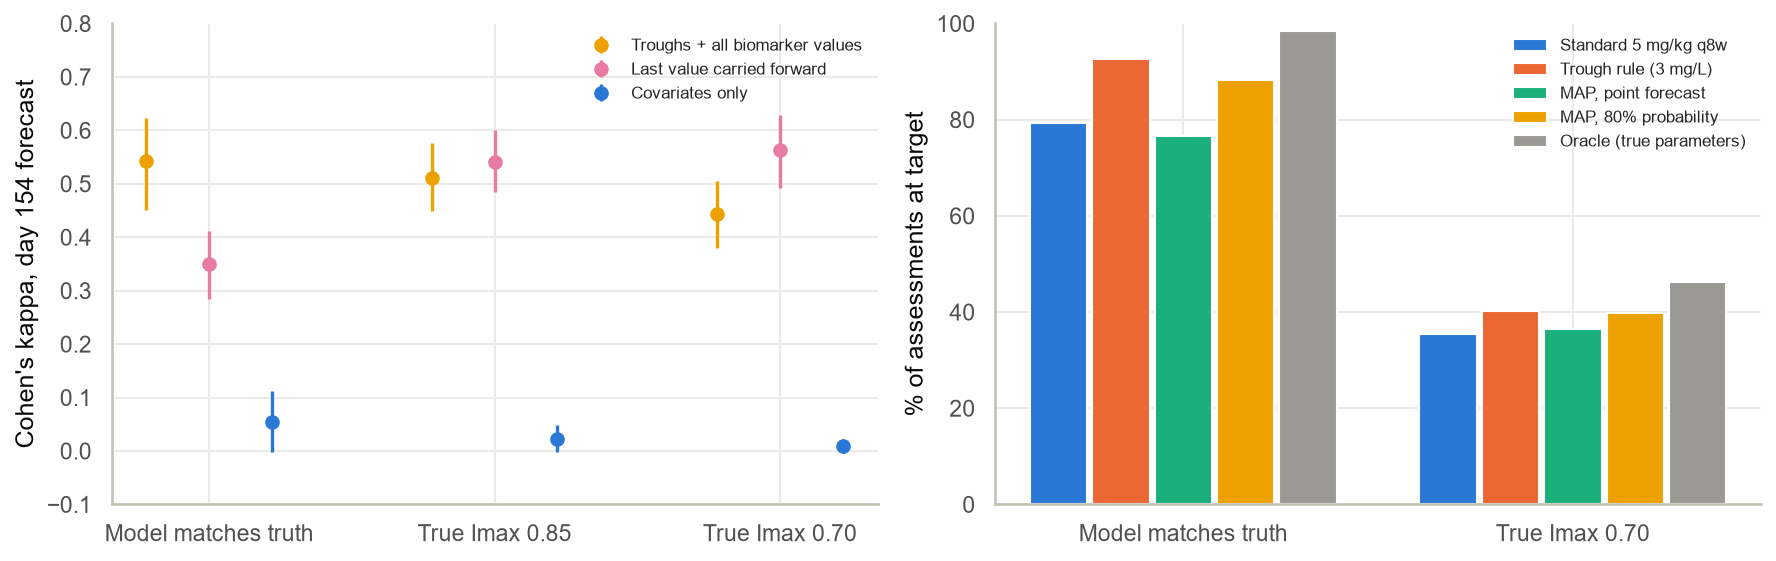
0.54
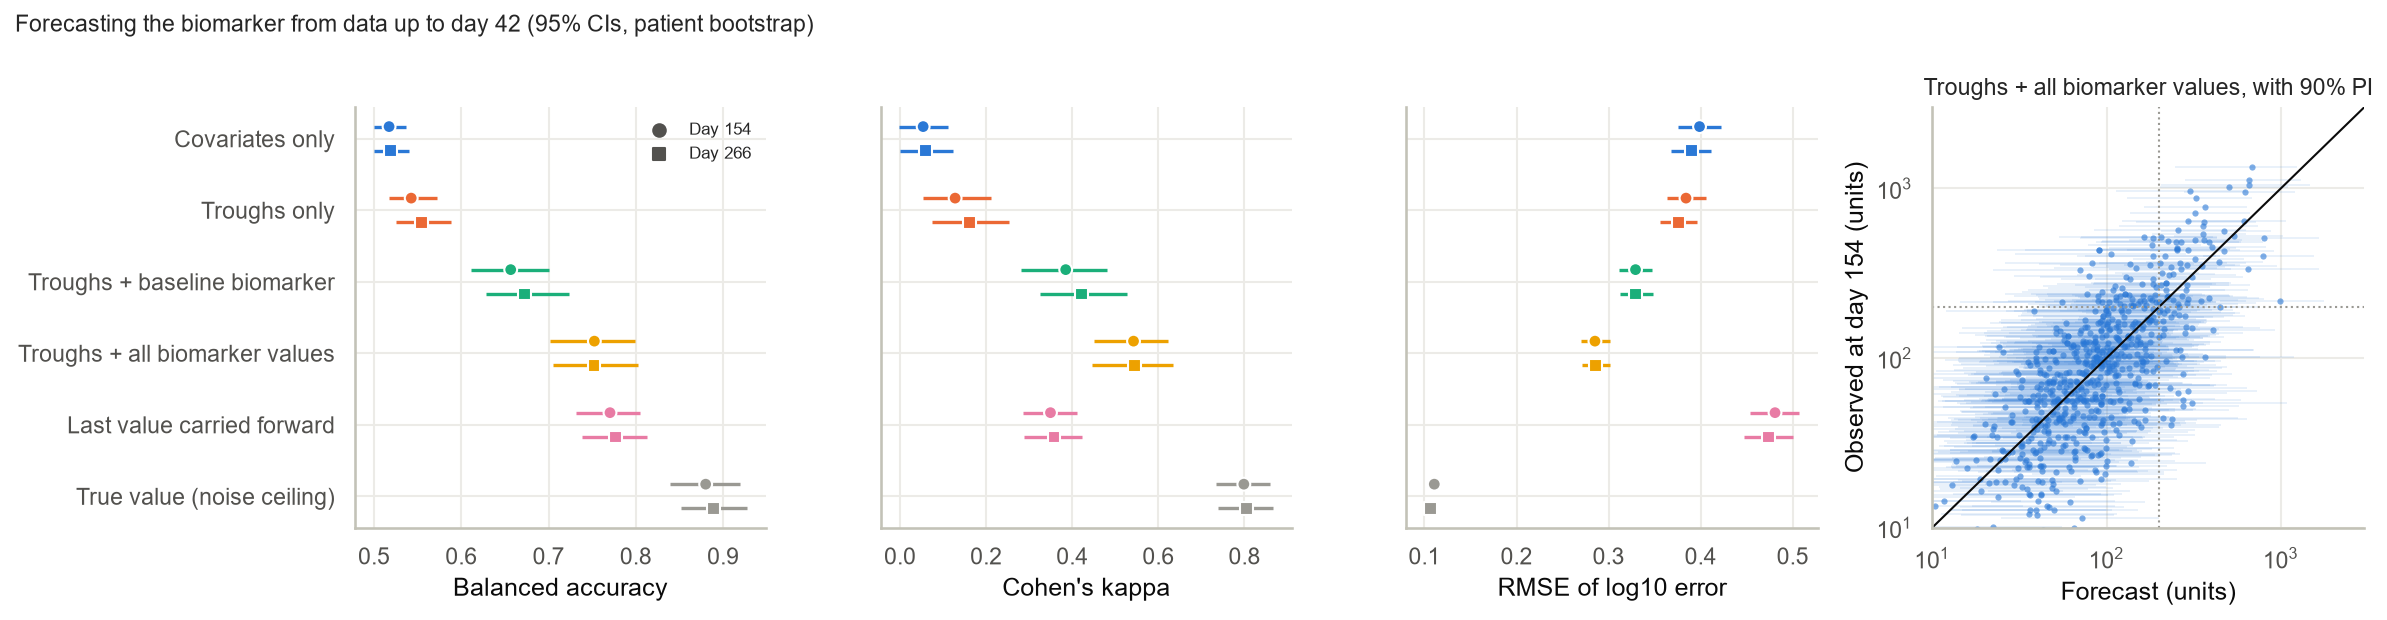
Cohen's kappa using troughs and all biomarker values to day 42 (95% CI 0.45 to 0.62). Covariates only: 0.05.
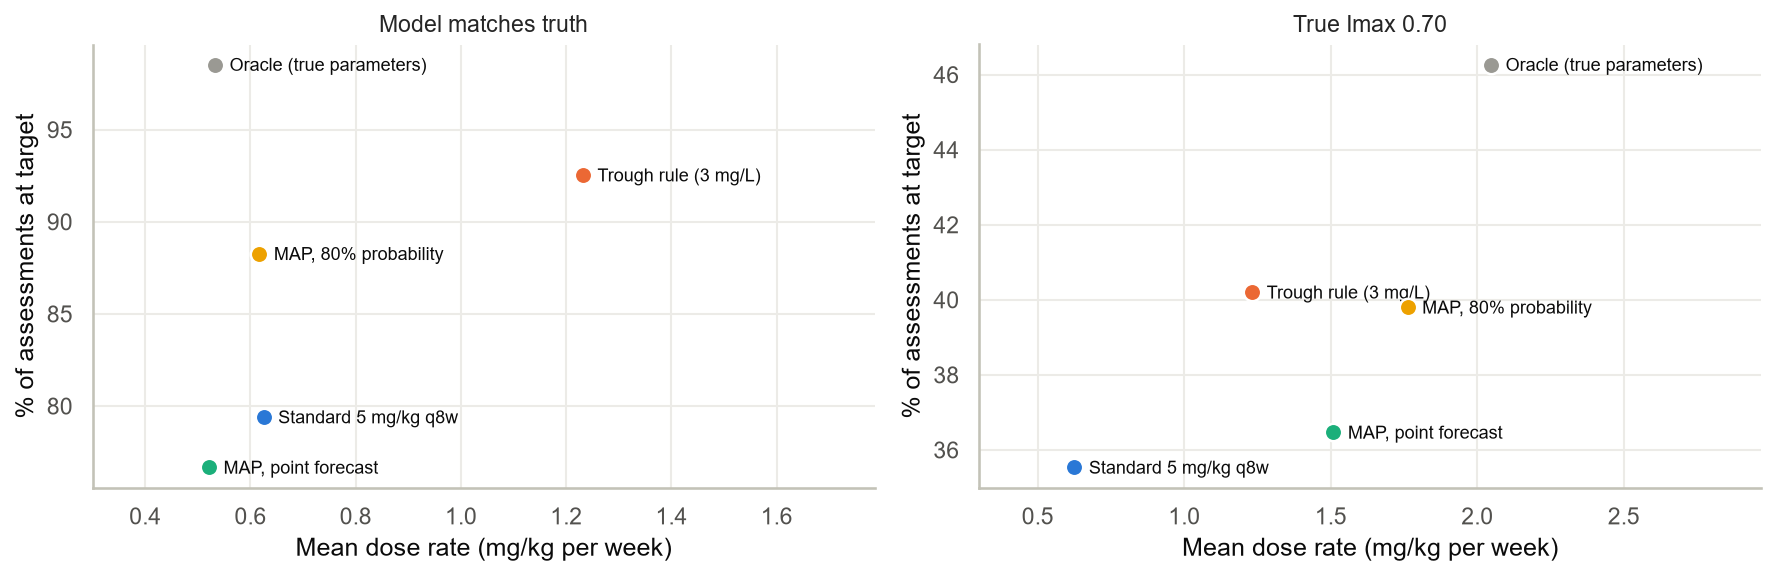
At target with the 80% rule
88.3%
Standard regimen 79.4%. Same dose rate, 0.62 mg/kg/week.
At target with the point-forecast rule
76.7%
Below the standard regimen. Its picks land just under 200.
Oracle ceiling
98.5%
The same search with the true parameters, at 0.53 mg/kg/week.

What the studies show

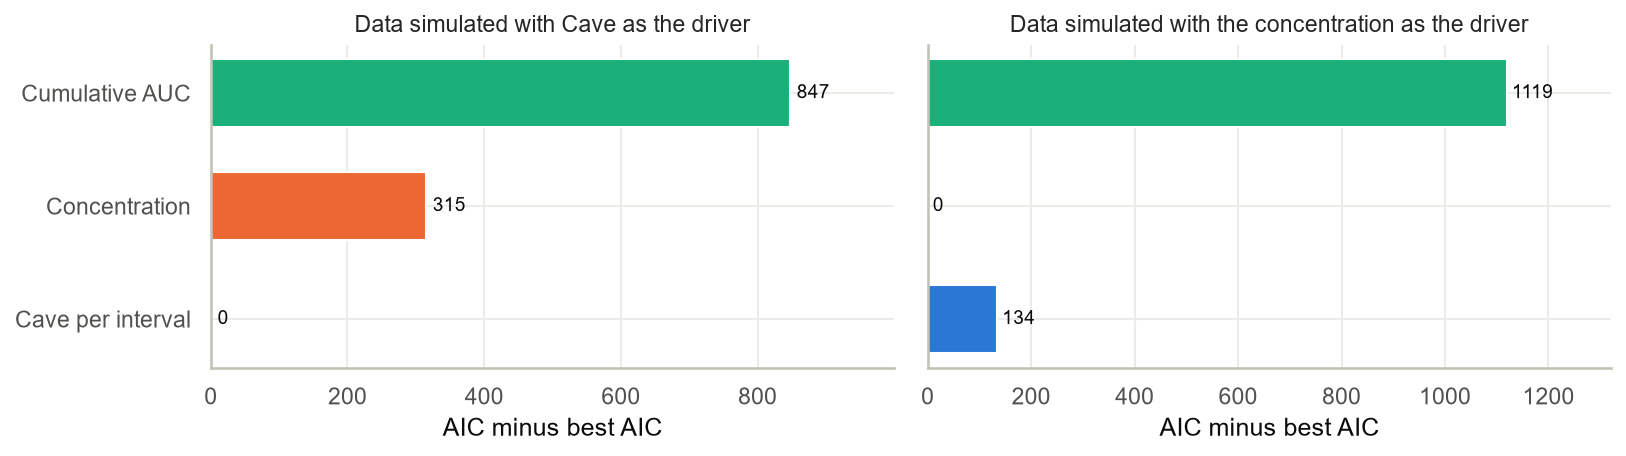
  1. The exposure driver can be told apart. On data driven by Cave the Cave model wins by 315 AIC points, and on data driven by the concentration the concentration model wins by 134.
  2. Troughs alone barely help the biomarker forecast (kappa 0.13 against 0.05 with covariates only). The pre-treatment biomarker lifts it to 0.38 and the values through day 42 to 0.54.
  3. The 80% rule gets 88.3% of assessments to target against 79.4% for the standard regimen, using about the same drug. The point-forecast rule does worse than standard (76.7%). The trough rule reaches 92.5% with 2.0 times the drug.
  4. When the true Imax is 0.70 the model still thinks more drug helps. Both MAP rules use 2.4 to 2.8 times the standard dose rate for a gain of 1 to 4 points.
How it works

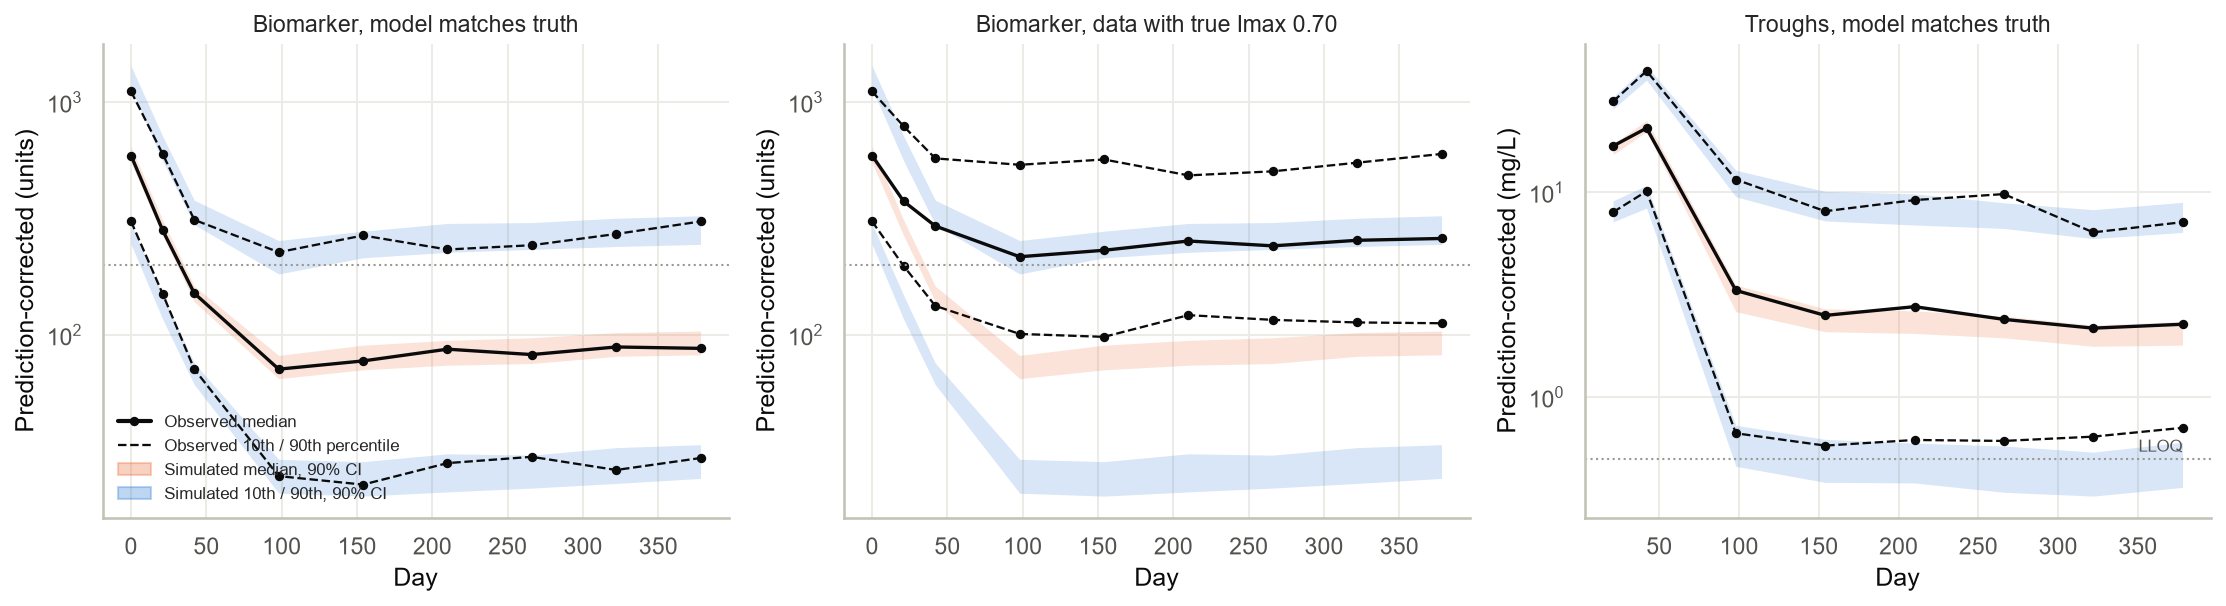
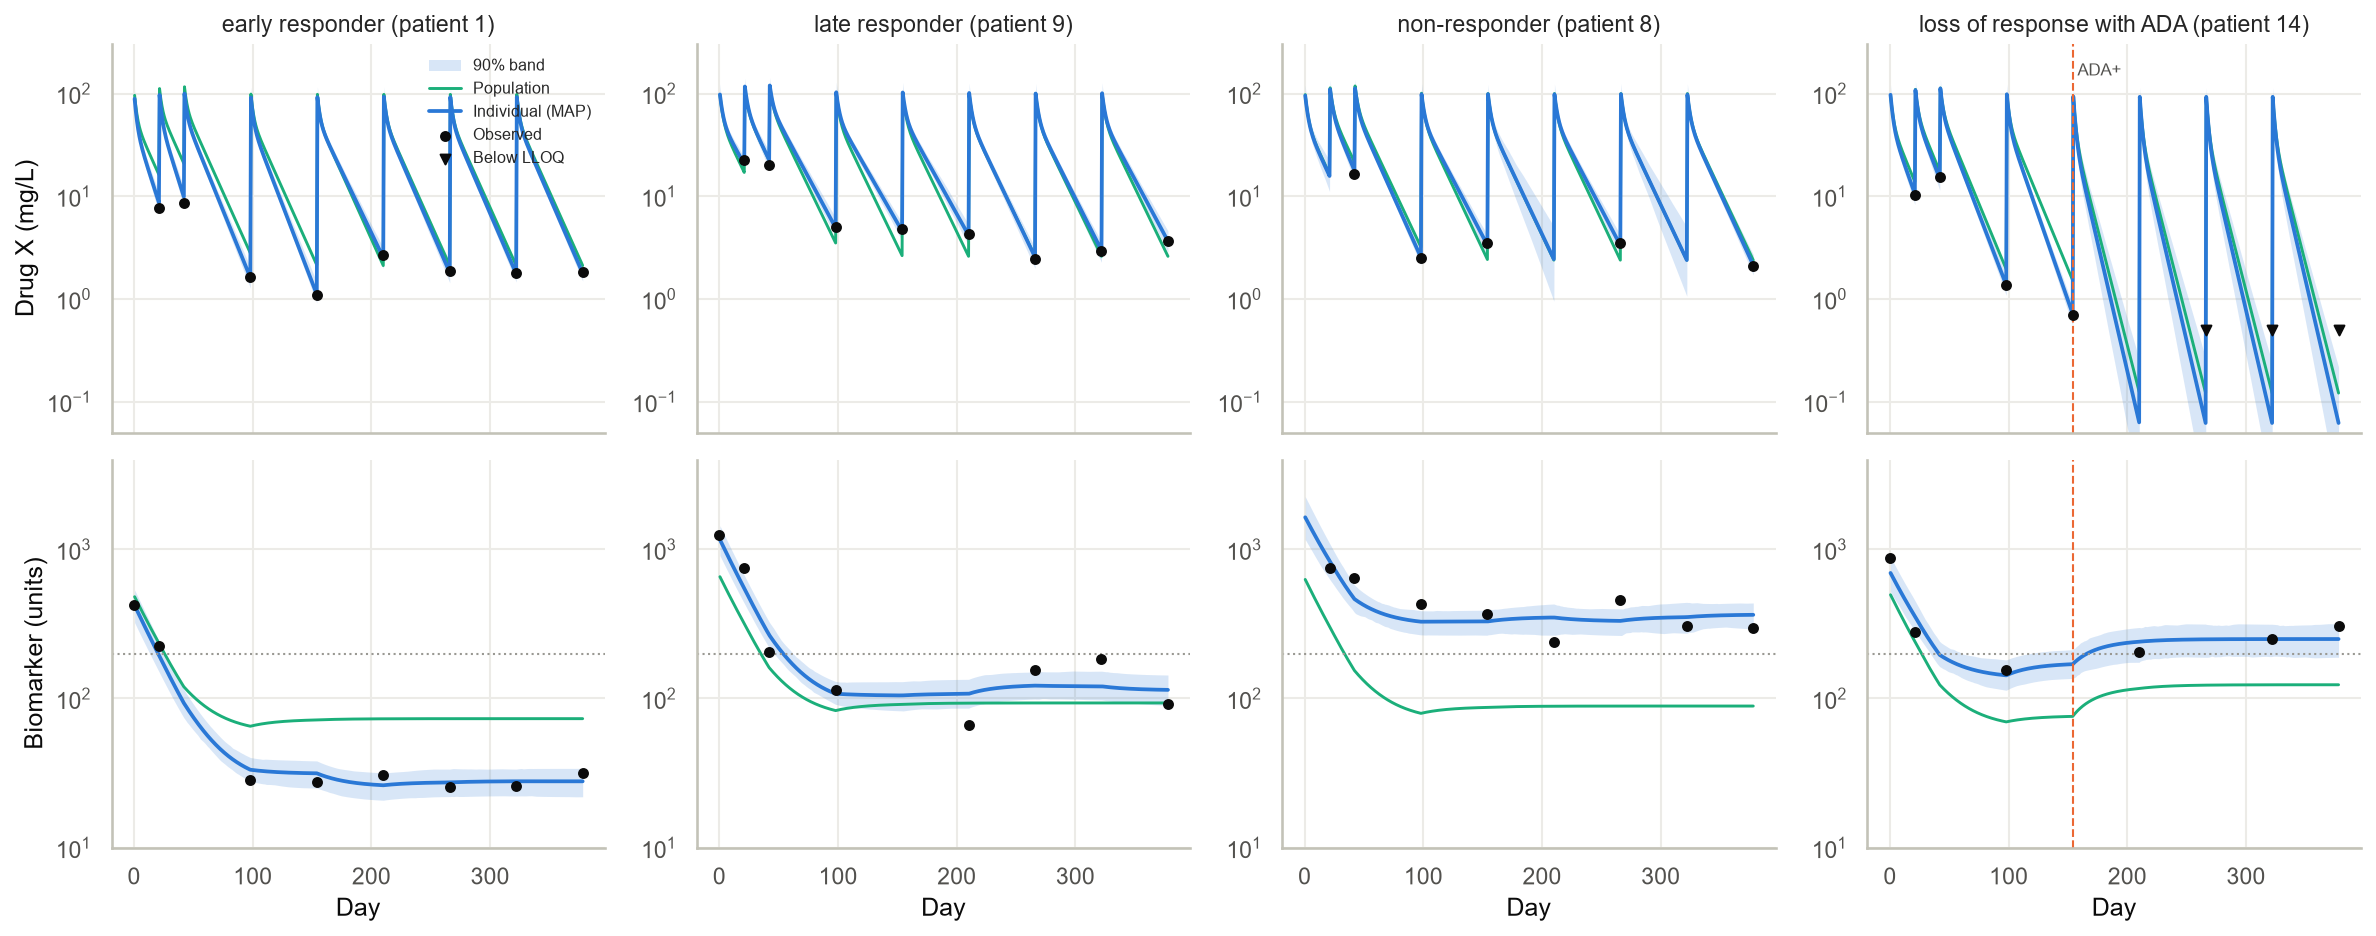
  • Drug X is a made-up IV drug with a two-compartment PK model. The biomarker follows an indirect response model, driven by Cave, the average concentration over each dosing interval.
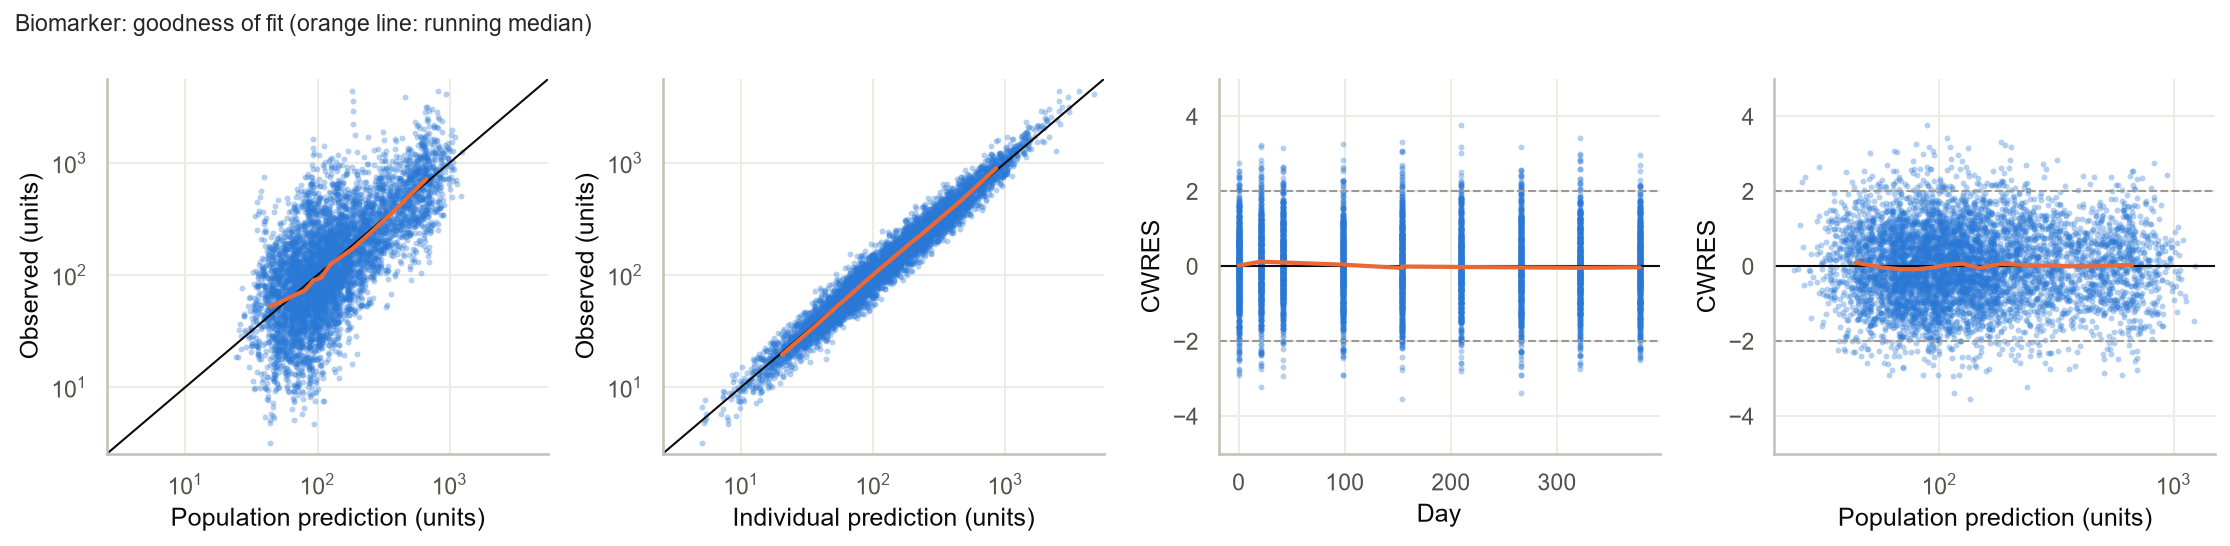
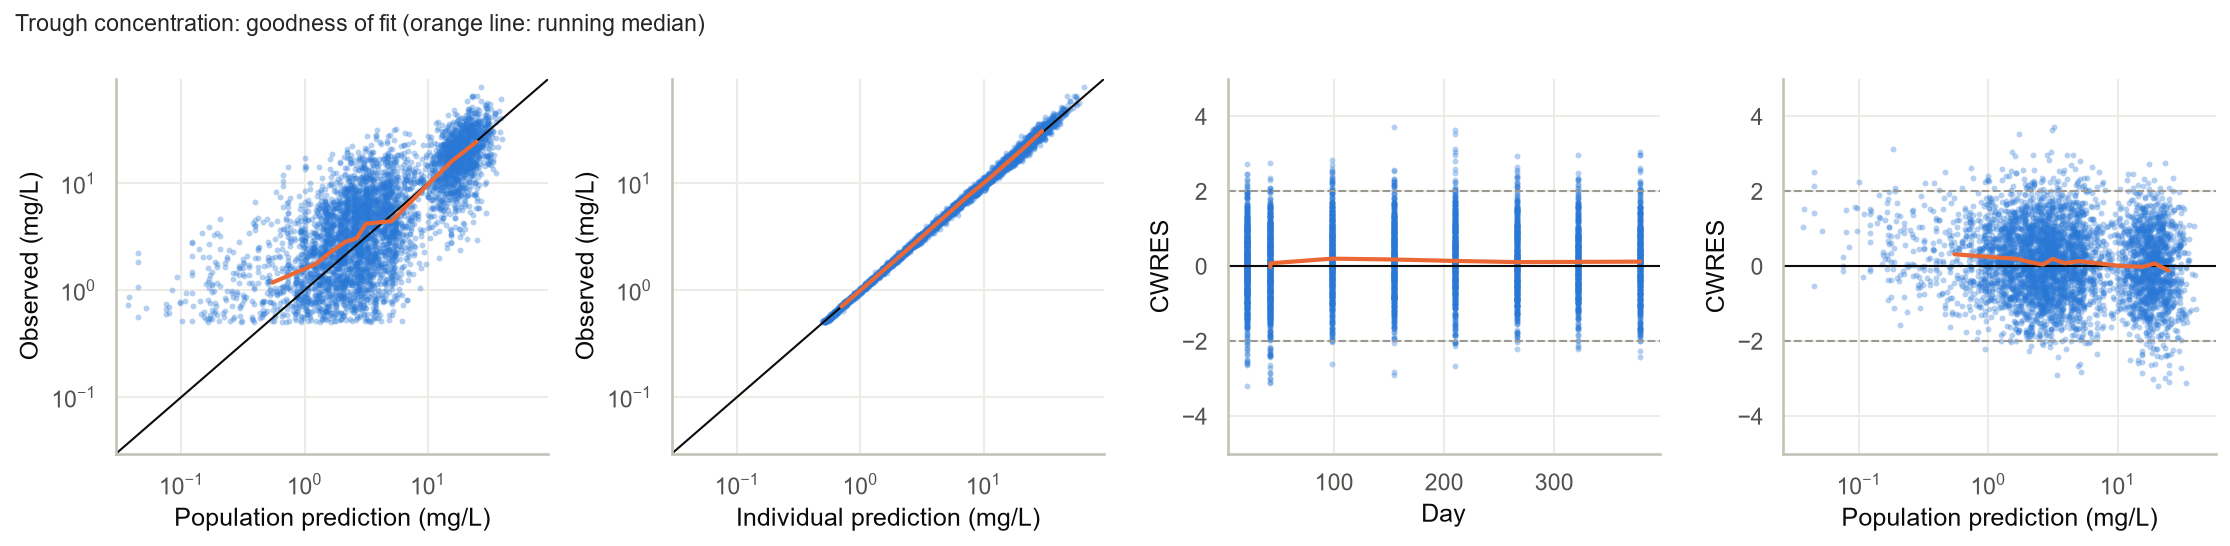
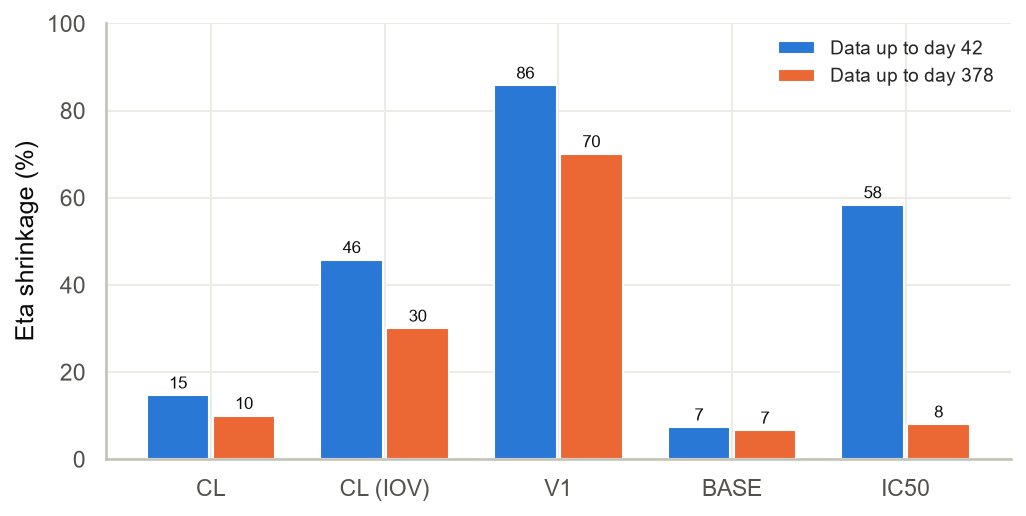
  • Each patient is fitted in two steps. MAP for CL, V1 and one IOV term per interval from the troughs (BLQ values count as censored), then MAP for BASE and IC50 from the biomarker, with Cave from the PK fit as a time-varying driver.
  • The next regimen is the cheapest on a grid of 2.5-15 mg/kg every 4-10 weeks that is forecast below 200. The point rule uses the posterior mode; the 80% rule needs 80% of posterior draws below target.
  • Study sizes: 800 patients for forecasting and diagnostics, 500 new ones for dosing, 150 for the driver comparison. The full run took about 8 minutes on 12 worker processes.

More detail on the model and the estimation is in the README.

Try it on one patient

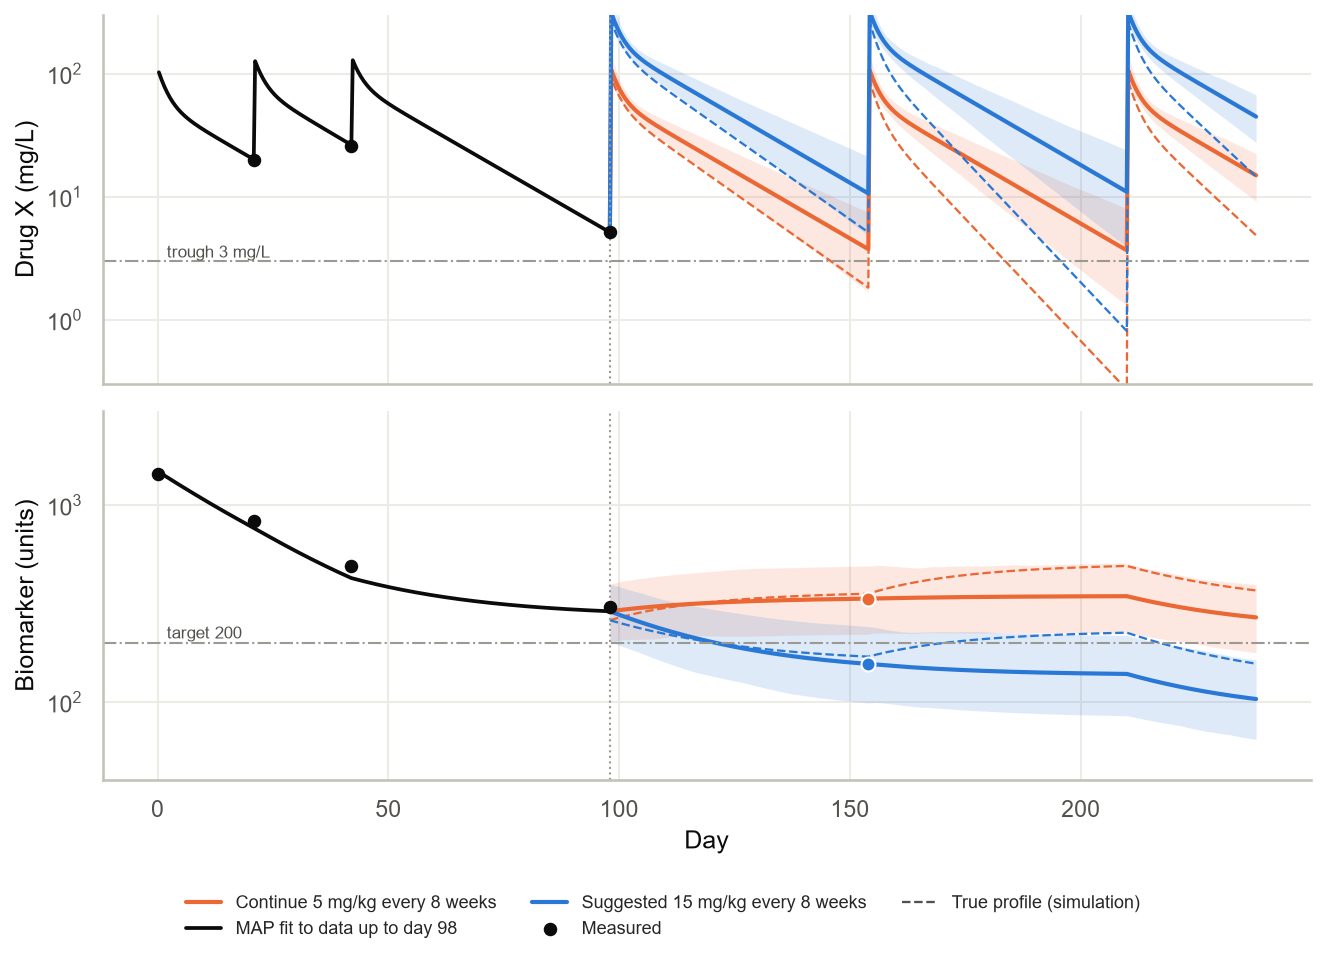
The dosing app runs the same sequential MAP fit in your browser. Enter covariates, doses, troughs and biomarker values, and it shows the fitted profiles, the forecast and the cheapest regimen that meets the rule. It opens with a patient whose trough is fine while the biomarker is still above target.

Open the dosing app

The first load downloads Python, numpy, scipy, pandas and matplotlib into the browser (Pyodide), so it takes a little while.