Findings

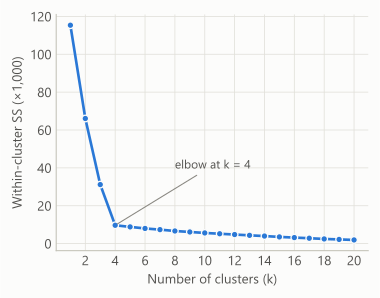
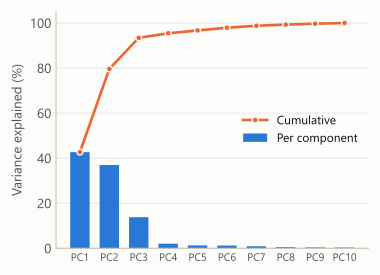
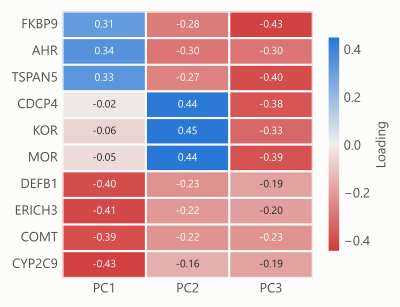
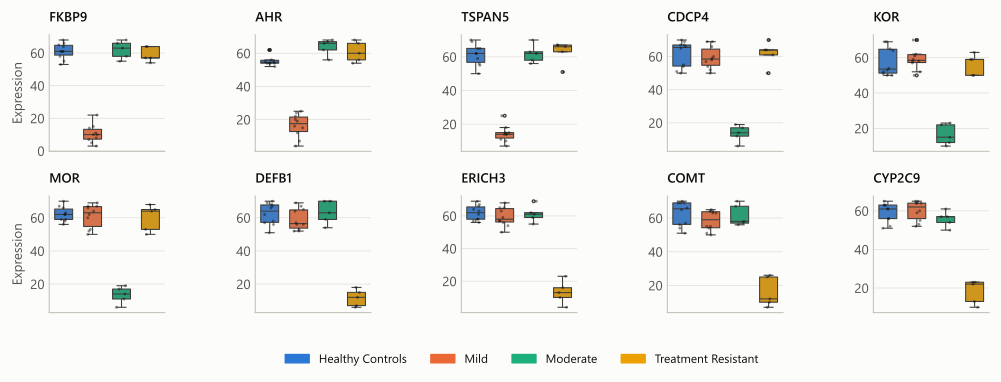
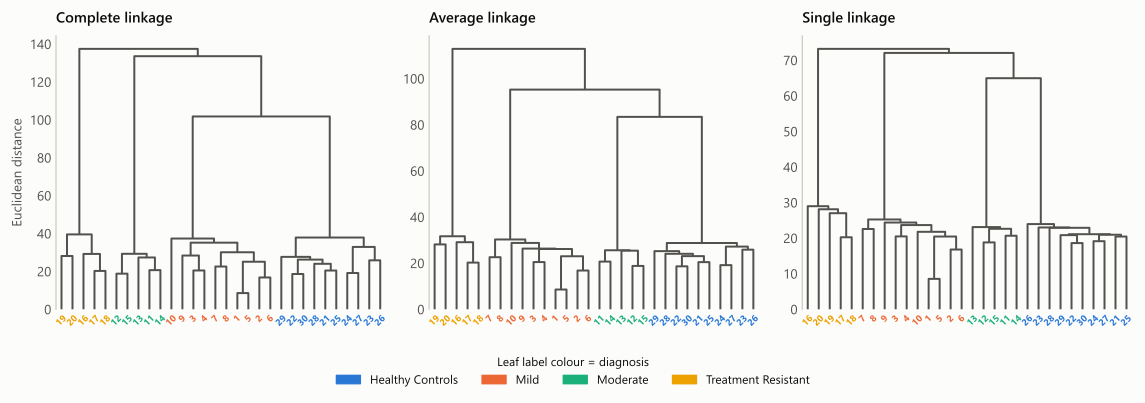
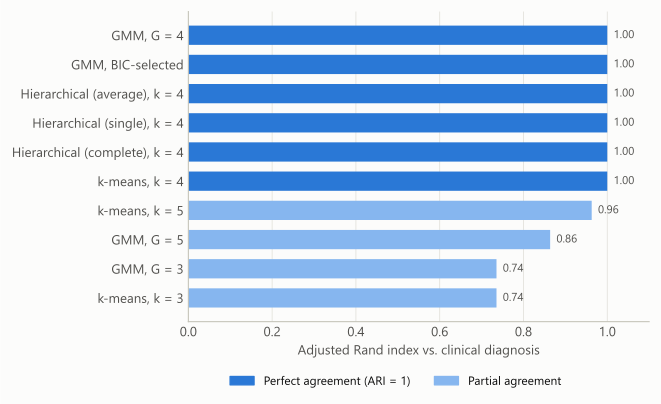
  1. Clusters match diagnosis. Four-cluster k-means, all three hierarchical linkages and the BIC-selected GMM reproduce the four diagnostic groups exactly.
  2. Clinical factors alone. With only sociodemographic factors and MDD severity, the linear SVM gets test AUC 0.90 and accuracy 0.82 (no-information rate 0.50).
  3. Adding biomarkers. Test AUC goes up to 0.95–1.00. At the default 0.5 threshold, though, the RBF SVM calls every patient a non-remitter and gradient boosting finds only about a quarter of remitters.
  4. External cohort. In analysis 3, biomarker levels in the external test cohort are about 30% lower than in training. The models still rank patients in the right order, but the predicted probabilities shift down.
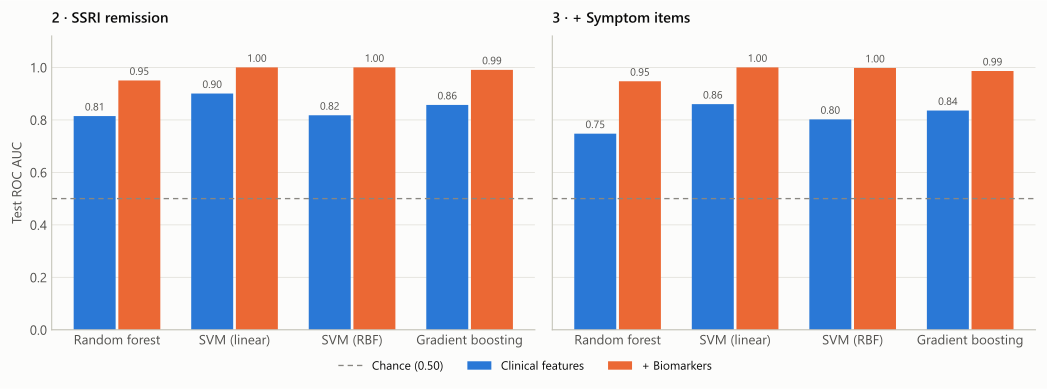
Test ROC AUC across all models

Held-out test set, with and without biomarkers. The dashed line is chance.

Grouped bar chart of test ROC AUC for four models in analyses 2 and 3

The three analyses

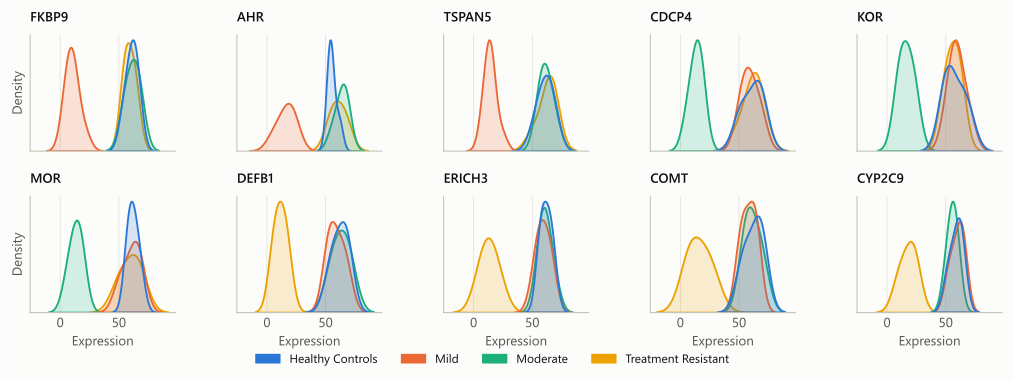
  1. Gene-expression clustering. 30 subjects × 10 genes. PCA, k-means, hierarchical clustering and Gaussian mixture models, scored by how well the clusters recover the clinical diagnosis (adjusted Rand index).
  2. SSRI remission. 400 patients with major depressive disorder, random 75/25 split. Random forest, linear and RBF SVMs and gradient boosting, trained on clinical factors with and without 9 biological markers.
  3. Symptom items. The same question with 12 baseline QIDS-SR symptom items added, a predefined 300-patient training cohort and a 100-patient external test cohort.

Evaluation

  • Hyperparameters were tuned with 5× repeated, stratified 10-fold cross-validation on the training set only.
  • Each model was scored once on the held-out test set.
  • Remission (response = 1) is the positive class for sensitivity, specificity and PPV/NPV.
  • Test accuracy is compared with the no-information rate (the majority-class share) using a one-sided exact binomial test.

The data are synthetic teaching datasets and aren't redistributed here. Only derived results are published.