Best out-of-fold AUROC
0.925
Elastic net on L4, bootstrap 95% CI 0.893 to 0.960
Baseline data only
0.806
best of four algorithms on L1, known on day 0
L3 to L4 gain
+0.087
elastic net, corrected p <0.001; PK/PD refitted with data to day 98
Ceiling
0.981
AUROC of the true simulated probability of being at target
Simulated cohort
189
patients in 3 studies, 72% at target

Findings

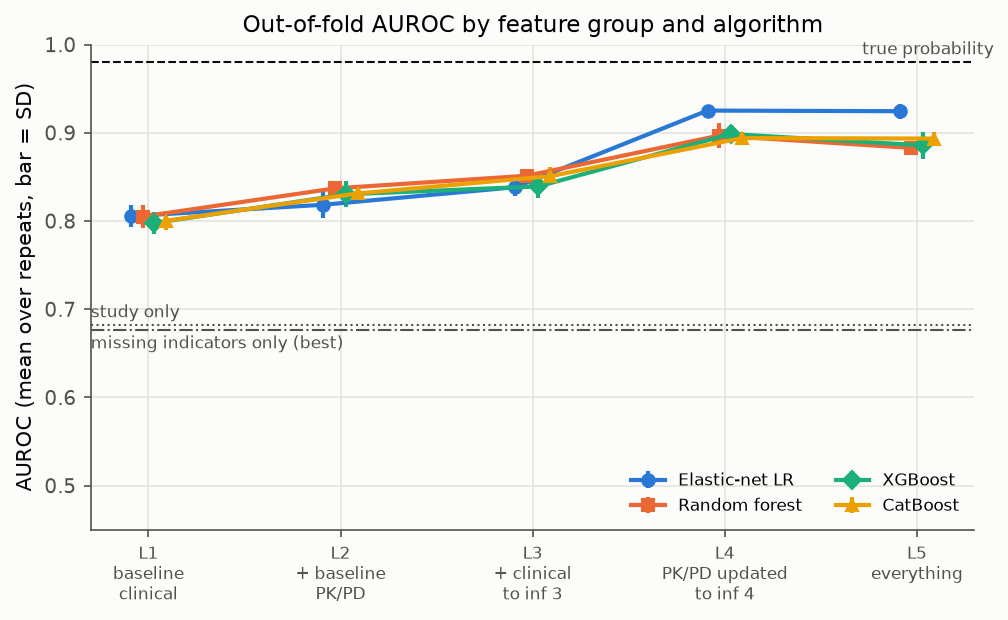
  1. Baseline data alone give an AUROC of 0.798 to 0.806 across the four algorithms. The true simulated probabilities reach 0.98, so a lot is left to explain.
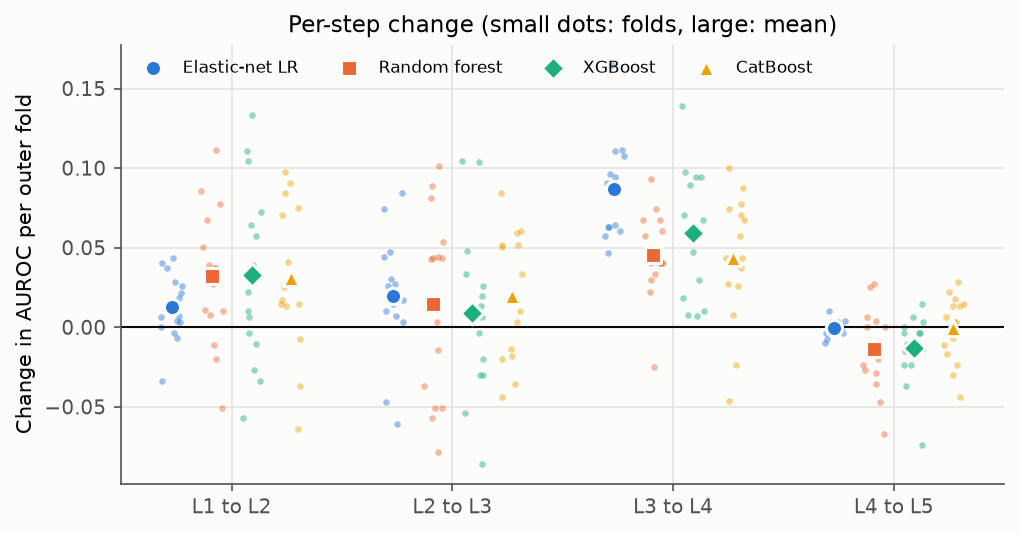
  2. The first PK/PD block (data to day 21) adds +0.013 to +0.033. A naive paired t-test calls all four significant (p 0.012 to 0.043); the corrected resampled t-test does not (p 0.21 to 0.33).
  3. Refitting PK/PD with data to day 98 is the big step: +0.043 to +0.087, corrected p below 0.05 for three of the four algorithms. The same day-98 data fed in as raw values (L4r) do about as well, so here the model mostly repackages what the raw data carry.
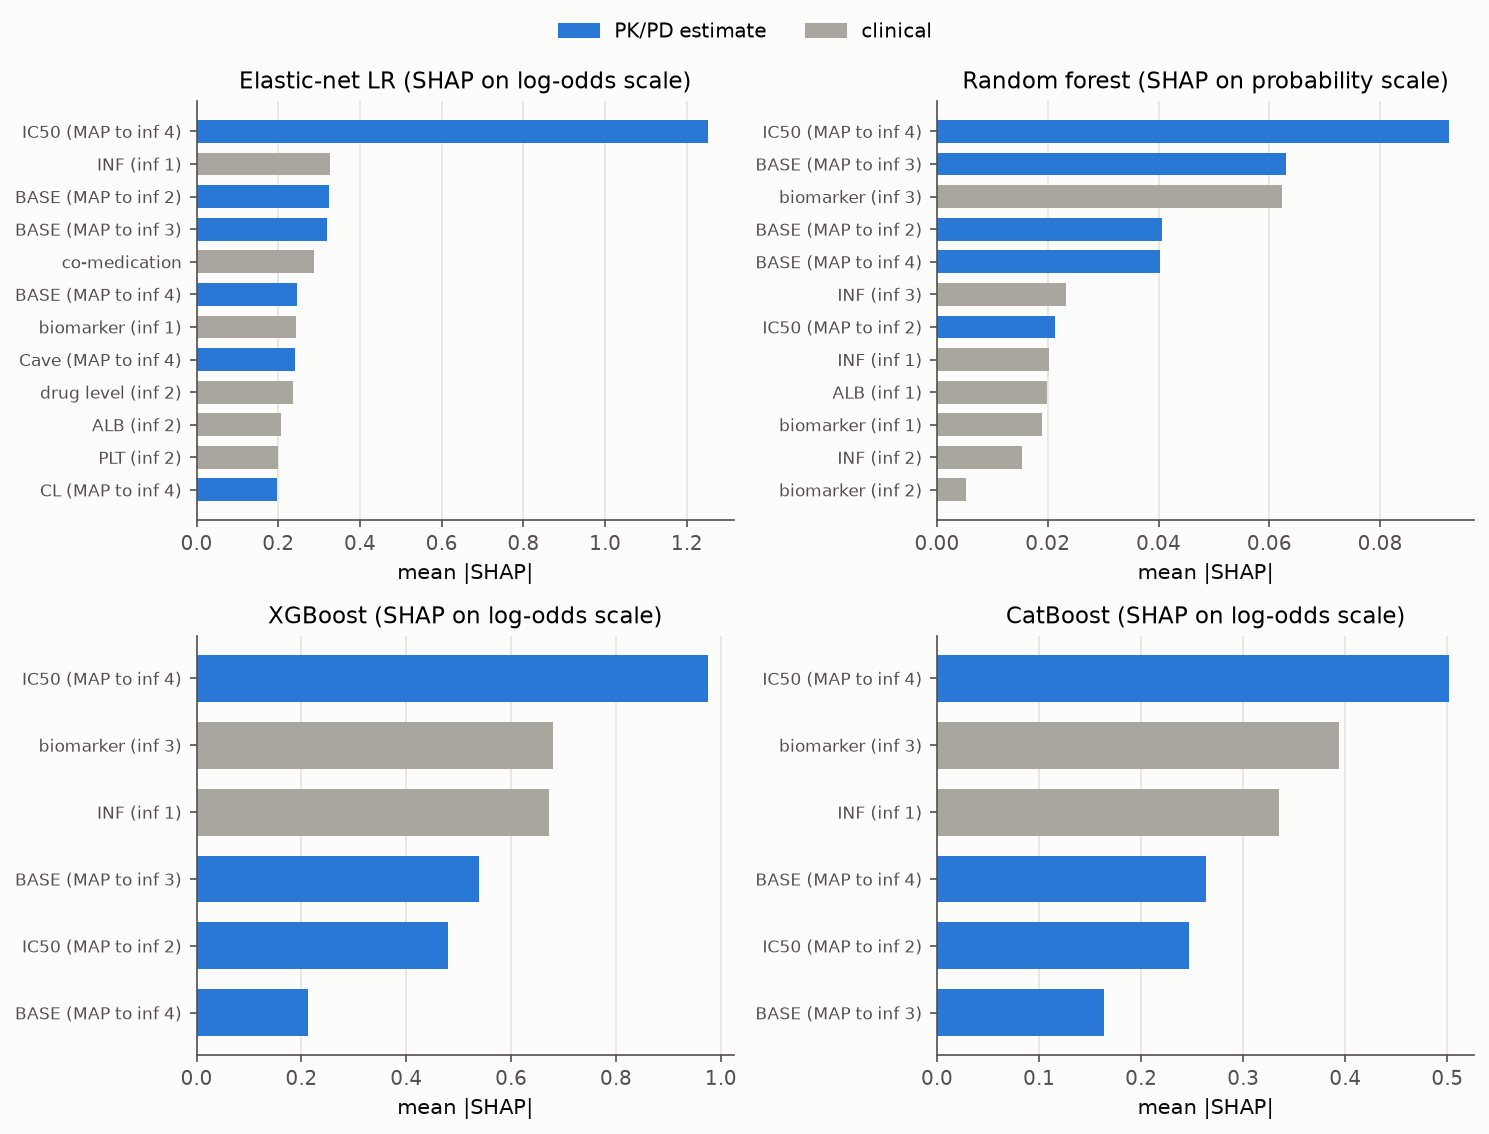
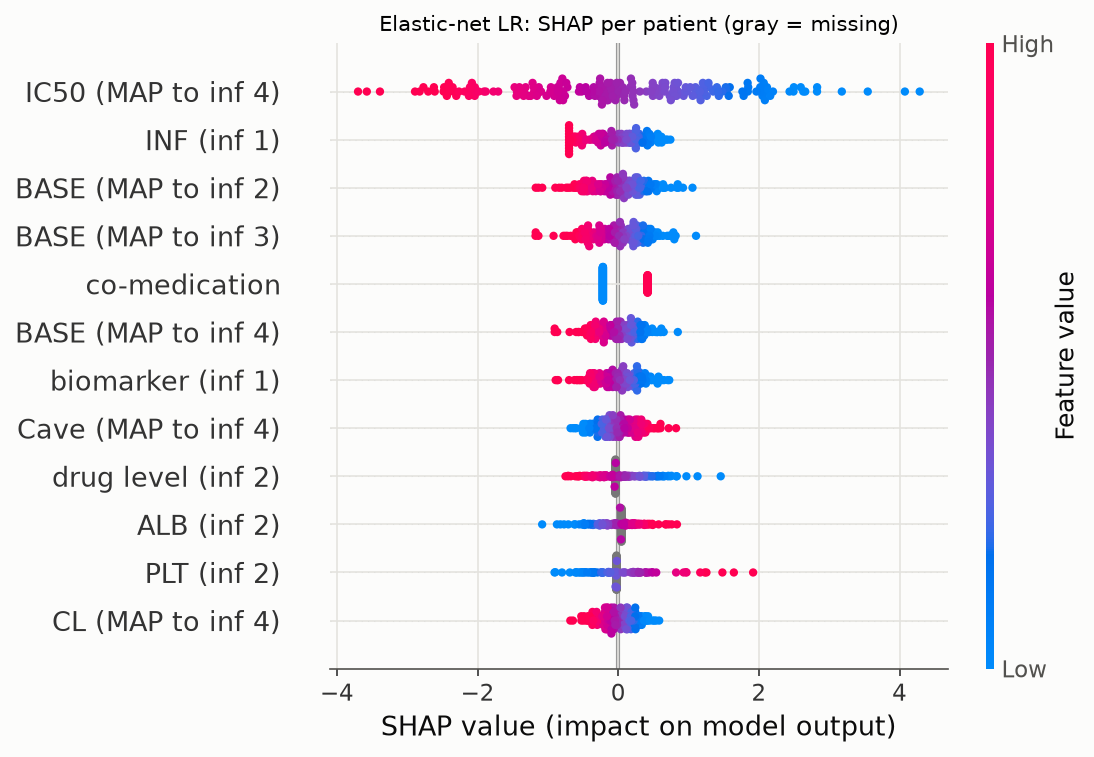
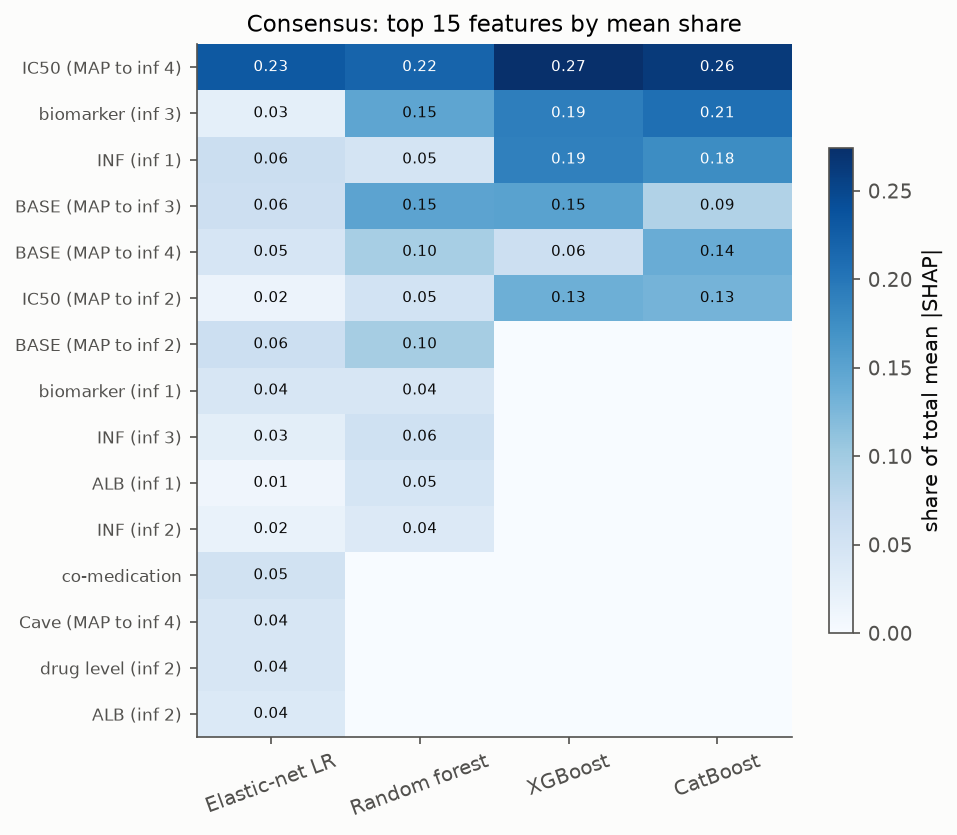
  4. SHAP from all four refitted models puts the day-98 IC50 estimate first (22% to 27% of the total). Summed SHAP tracks the true mechanism well for baseline level and drug sensitivity and poorly for exposure.
The feature ladder

Each step adds a block of features. The dot marks the day every feature in the step is known; the outcome is read between day 315 and day 399. L4r is a side check outside the ladder.

L1Baseline clinicalbaseline clinical9day 0
L2+ baseline PK/PDbaseline clinical + PK/PD fit to infusion 214day 21
L3+ clinical to infusion 3baseline clinical + clinical at infusion 2 + clinical at infusion 3 + PK/PD fit to infusion 228day 42
L4PK/PD updated at infusion 4baseline clinical + clinical at infusion 2 + clinical at infusion 3 + PK/PD fit to infusion 428day 98
L5Everythingbaseline clinical + clinical at infusion 2 + clinical at infusion 3 + PK/PD fit to infusion 2 + PK/PD fit to infusion 3 + PK/PD fit to infusion 438day 98
L4r (check)Raw data to infusion 4baseline clinical + clinical at infusion 2 + clinical at infusion 3 + clinical at infusion 4 + PK/PD fit to infusion 235day 98

Discrimination

AUROC by feature group and algorithm

Mean out-of-fold AUROC over 3 repeats of 5-fold nested CV. The repeat SD only reflects seed sensitivity; the SD over outer folds (0.05 to 0.09, with 37 to 38 patients per test fold) is the better guide. Click a legend entry to hide an algorithm.

Static PNG
L10.806 (0.013)0.805 (0.013)0.798 (0.013)0.800 (0.011)
L20.818 (0.015)0.837 (0.009)0.830 (0.015)0.831 (0.002)
L30.838 (0.010)0.851 (0.005)0.839 (0.013)0.851 (0.010)
L40.925 (0.006)0.897 (0.014)0.899 (0.010)0.894 (0.007)
L50.925 (0.009)0.883 (0.001)0.886 (0.015)0.894 (0.007)
L4r0.916 (0.013)0.915 (0.002)0.912 (0.004)0.918 (0.009)

Change at each step

Small points are the 15 paired per-fold differences, large points their mean. p values in the table use the Nadeau and Bengio corrected resampled t-test; the naive paired t-test is shown next to it to show how much it overstates the evidence.

Static PNG
L1 to L2Elastic net+0.0130.290.03
L1 to L2Random forest+0.0320.210.01
L1 to L2XGBoost+0.0330.330.04
L1 to L2CatBoost+0.0310.260.02
L2 to L3Elastic net+0.0200.370.06
L2 to L3Random forest+0.0140.670.36
L2 to L3XGBoost+0.0090.760.51
L2 to L3CatBoost+0.0190.400.08
L3 to L4Elastic net+0.087<0.001<0.001
L3 to L4Random forest+0.0450.01<0.001
L3 to L4XGBoost+0.0590.02<0.001
L3 to L4CatBoost+0.0430.080.001
L4 to L5Elastic net−0.0010.800.59
L4 to L5Random forest−0.0140.350.05
L4 to L5XGBoost−0.0130.300.04
L4 to L5CatBoost−0.0010.960.92
L4r to L4Elastic net+0.0090.580.24
L4r to L4Random forest−0.0180.460.12
L4r to L4XGBoost−0.0130.460.12
L4r to L4CatBoost−0.0240.330.04

Raw values against the PK/PD model

L4 and L4r use data up to the same day. Tree models do slightly better with the raw values (−0.024 to −0.013 for L4 against L4r) and the elastic net slightly worse (+0.009). None of these is significant (corrected p 0.33 to 0.58).

Checks

Leave one study out

Train on two studies, test on the third. At L4 the mean AUROC in the held-out study is 0.84 to 0.91; study B, with the lightest patients and the most ADA, is the hardest. Columns only one study measured are dropped when that study is held out.

All leave-one-study-out results
AL10.7700.7900.7650.742
BL10.6700.7420.7270.658
CL10.8500.8570.8340.863
AL20.8070.8180.7940.831
BL20.7110.7370.7430.718
CL20.7670.8390.8200.834
AL30.8450.8790.8100.876
BL30.7380.7800.7740.773
CL30.8330.8890.8820.866
AL40.8870.8870.8850.922
BL40.8710.8070.8550.837
CL40.9390.8950.8940.911
AL50.8880.9030.8910.896
BL50.8670.8210.8240.846
CL50.9420.9150.9080.923

Missingness and study-only checks

Missingness depends on the study. A model on missing-value indicators alone reaches 0.64 to 0.68, and one on study membership alone 0.68. Error bars are the SD over outer folds.

Missing data by study

Share of patients with each feature missing, for the features that are ever missing. Columns more than 70% missing in a training fold are dropped.

Imputation sensitivity

L5 with five imputers, first repeat only, mean and SD over 5 folds. The spread within an algorithm is at most 0.038, well inside the fold-to-fold SD.

Calibration

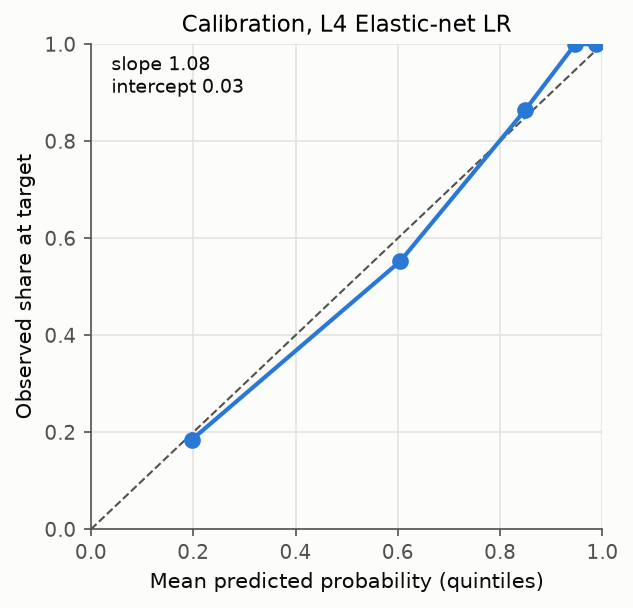
Calibration of the best model

Elastic net on L4, out-of-fold predictions averaged over repeats and split into fifths. Slope 1.08, intercept 0.03.

Static PNG

Calibration slope and intercept

From logistic recalibration of the out-of-fold predictions. XGBoost is overconfident (slope 0.78 to 0.88) and random forest underestimates the chance of being at target at L1, L3, L4 and L5 (intercept 0.20 to 0.46).

Table
L1Elastic net1.06+0.02
L1Random forest1.06+0.46
L1XGBoost0.88−0.03
L1CatBoost1.08+0.15
L2Elastic net0.99+0.02
L2Random forest1.20+0.07
L2XGBoost0.83−0.04
L2CatBoost1.19+0.17
L3Elastic net1.20+0.00
L3Random forest1.10+0.32
L3XGBoost0.78−0.09
L3CatBoost1.24+0.15
L4Elastic net1.08+0.03
L4Random forest1.29+0.34
L4XGBoost0.86−0.22
L4CatBoost1.11+0.00
L5Elastic net1.02+0.04
L5Random forest1.16+0.20
L5XGBoost0.81−0.15
L5CatBoost1.29+0.02

Precision and recall

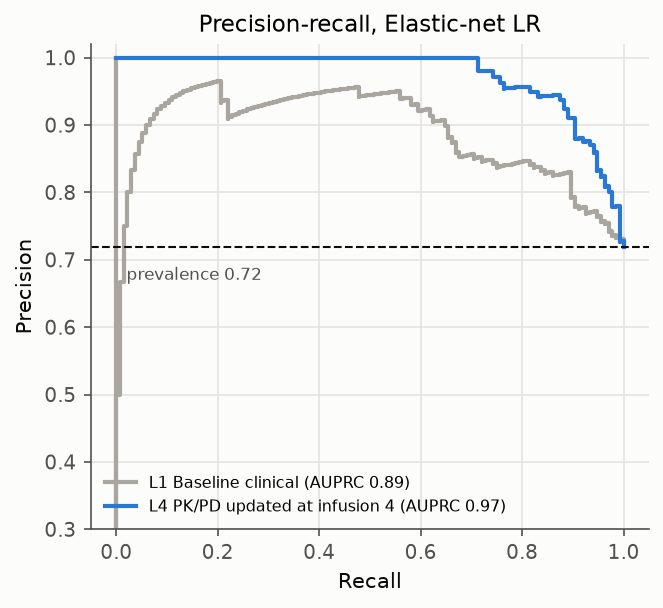
AUPRC is 0.97 at L4 against 0.89 at L1, with a prevalence of 0.72.

Static PNG

Decision curve

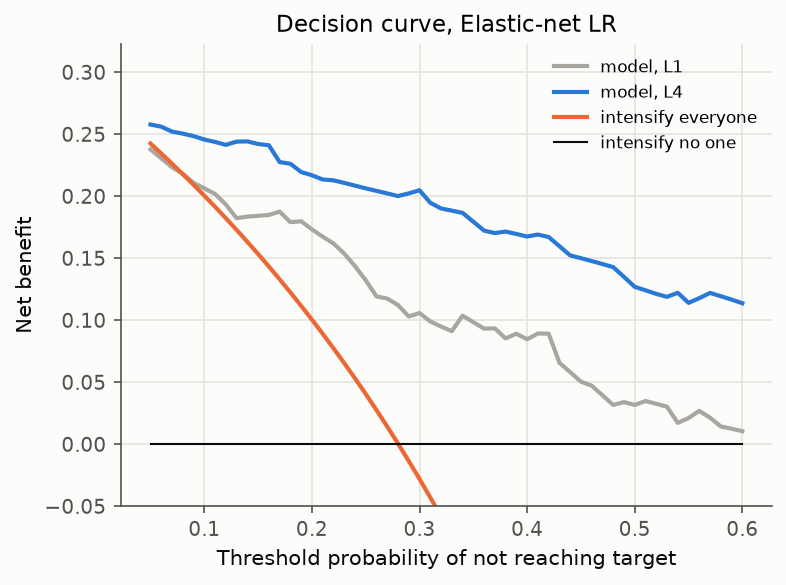
The action is dose intensification for a patient predicted to miss target. The L4 model beats intensifying everyone or no one at every threshold from 0.05 to 0.60, for example 0.20 at 0.3 where treating everyone gives −0.03.

Static PNG

SHAP

Global SHAP importance

Top features of the model refitted on the full cohort (L5). The refitted models keep 29 (elastic net), 12 (random forest), 6 (XGBoost) and 6 (CatBoost) features. SHAP is on the log-odds scale except for random forest, so sizes are not comparable across algorithms.

Static PNG

SHAP per patient

Each dot is a patient. Color is the feature value within the cohort, from low (blue) to high (orange). Positive SHAP pushes the prediction towards target; a high IC50 or BASE estimate pushes it away.

Static PNG

Consensus across algorithms

Share of total |SHAP| per feature for the features with the largest mean share. The day-98 IC50 estimate is first for all four; the trees lean more on the raw day-42 biomarker.

Static PNG

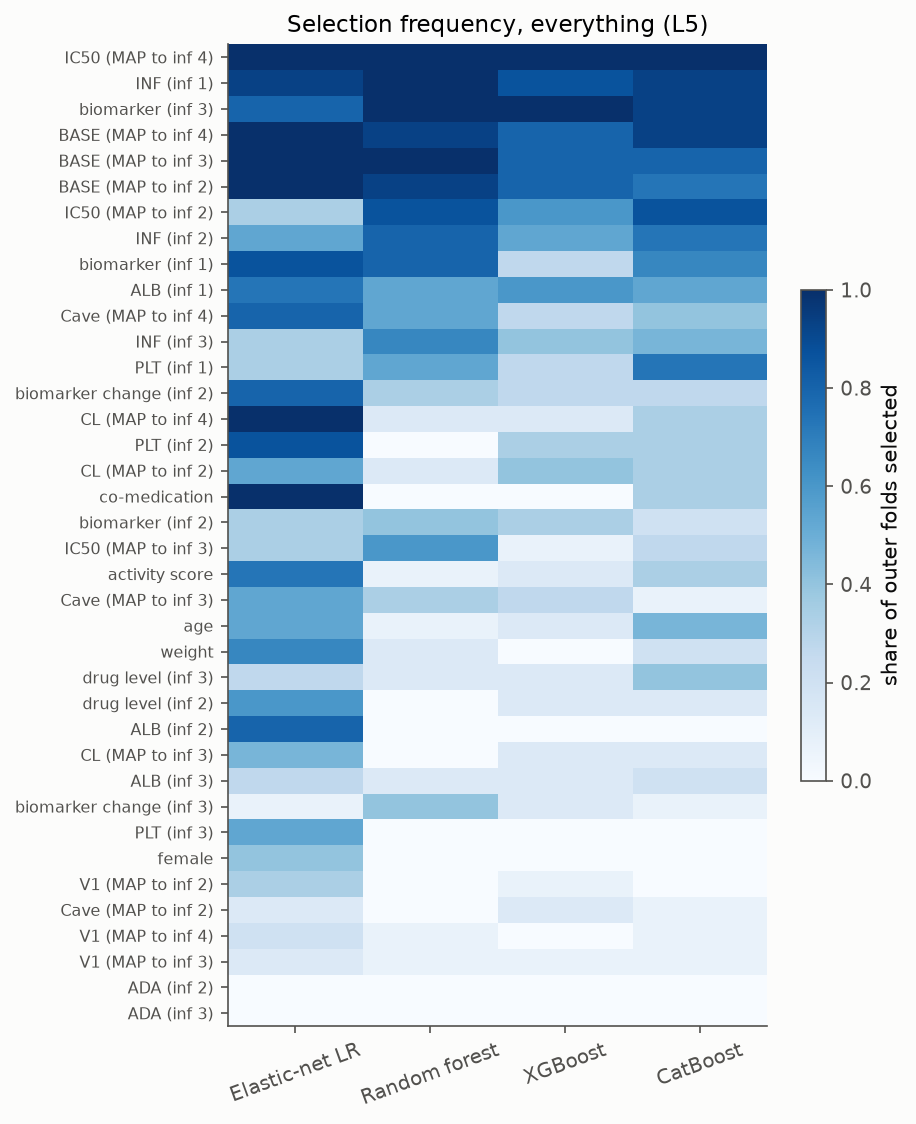
Feature selection frequency

Share of the 15 outer folds in which each feature was kept (RFE for the trees, a non-zero coefficient for the elastic net). On L5 the day-98 IC50 estimate is kept in 100% of folds by every algorithm.

Static PNG

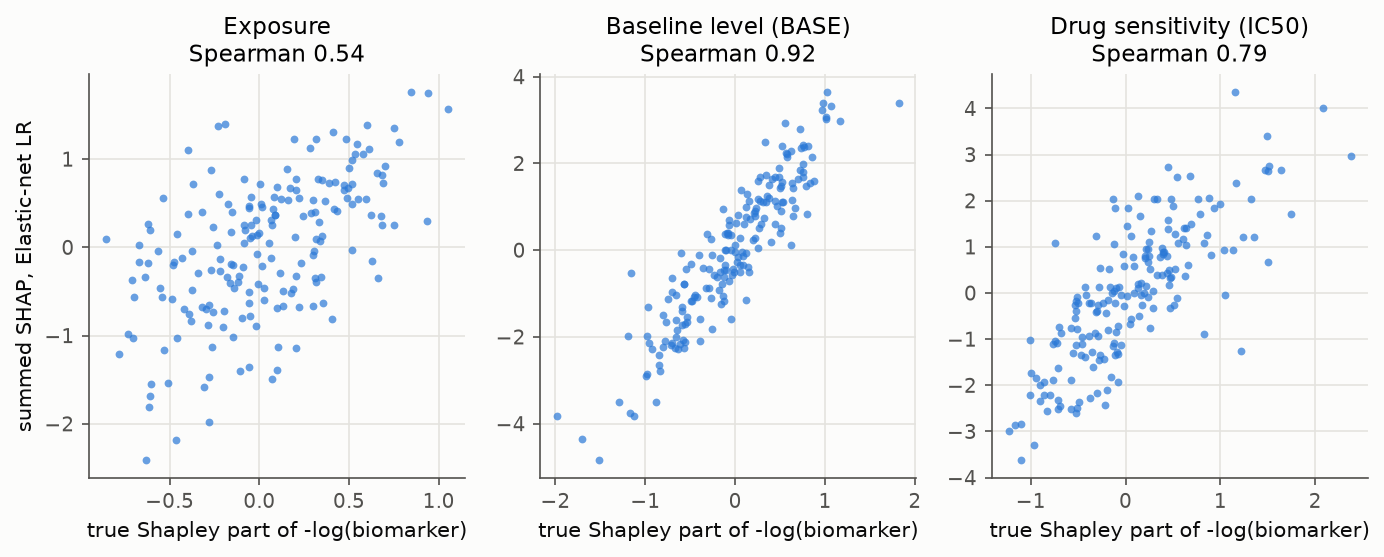
SHAP against the known mechanism

The true late biomarker is split into exact Shapley parts for exposure, baseline level and drug sensitivity, and SHAP is summed within the feature groups that mostly carry each part. The truth gives exposure 25%; the models give it 0% to 18%. Spearman correlations per patient are 0.80 to 0.92 for baseline level and 0.69 to 0.79 for drug sensitivity.

Static PNG
Elastic net0.540.920.79
Random forest0.410.910.74
XGBoostnone kept0.800.69
CatBoostnone kept0.810.69

Summed SHAP against the true part, per patient

Pick an algorithm and a mechanism group. XGBoost and CatBoost dropped every exposure feature during feature elimination, so their exposure panels are flat.

Cohort and PK/PD

Simulated biomarker trajectories

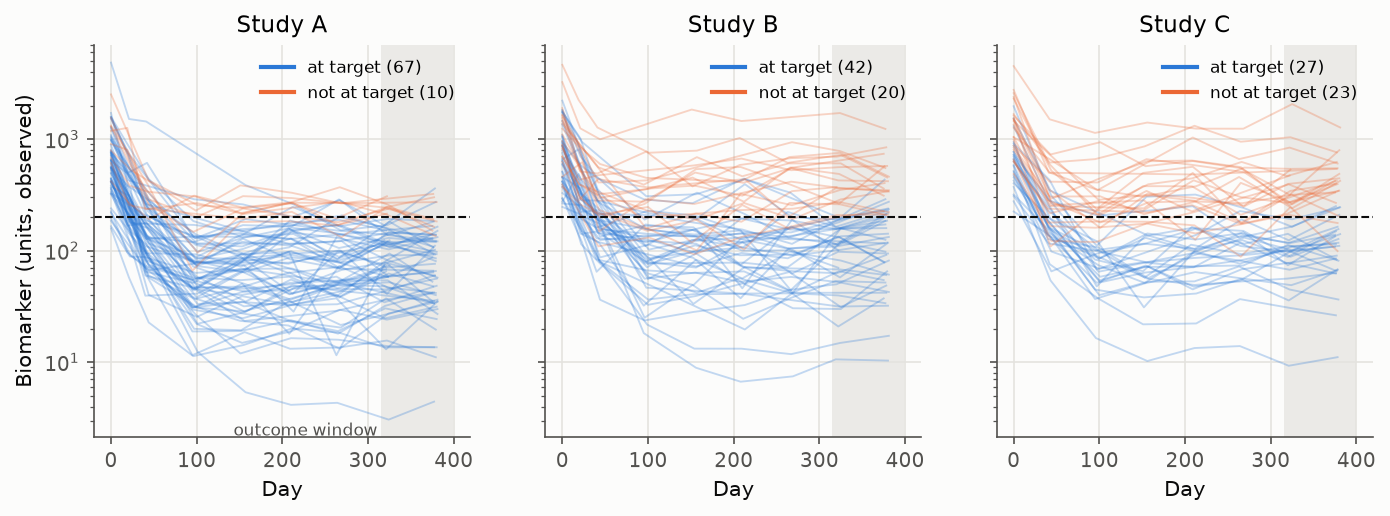
Observed biomarker for every patient, colored by outcome. A patient is at target if the first value in the outcome window is below 200 units. Double-click a legend entry to show one group only.

Static PNG
A7787%13%65.3618
B6268%45%39.9841
C5054%28%57.5788
All18972%28%54.9707

MAP estimates against the truth

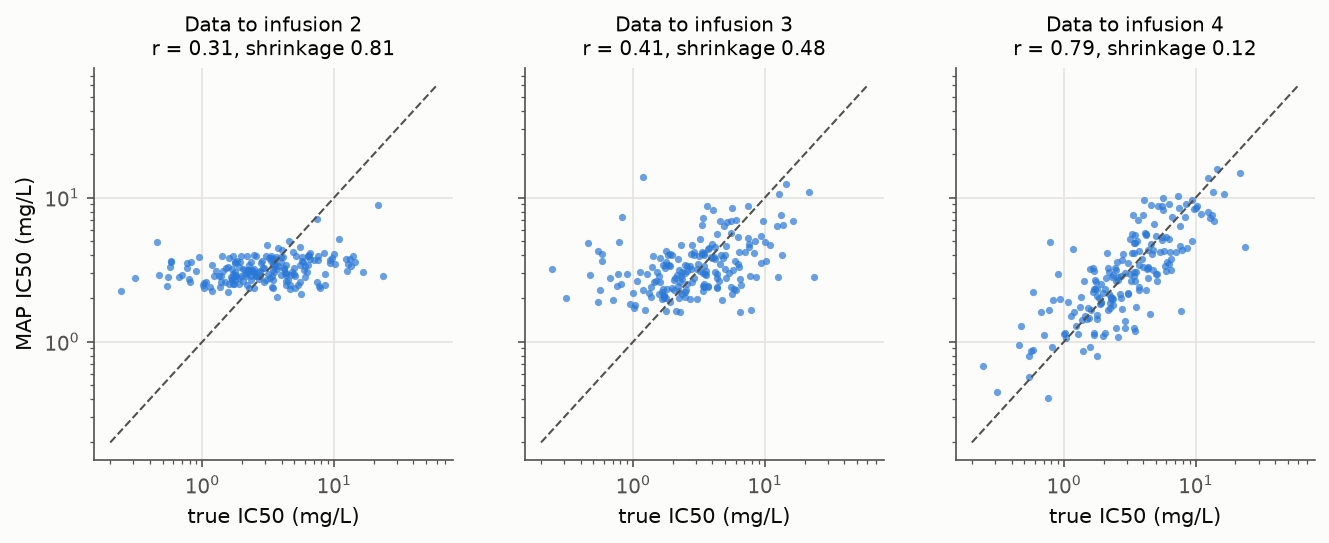
Individual estimates from the sequential PK-then-PD fit against the simulated true values. IC50 is barely identifiable early (r 0.31 with data to day 21) and much clearer by day 98 (r 0.79). The table gives r on the log scale and shrinkage.

Static PNG
data to day 210.86 / 0.200.90 / 0.530.94 / 0.080.31 / 0.81
data to day 420.94 / -0.030.90 / 0.510.96 / 0.070.41 / 0.48
data to day 980.95 / -0.030.90 / 0.220.96 / 0.060.79 / 0.12