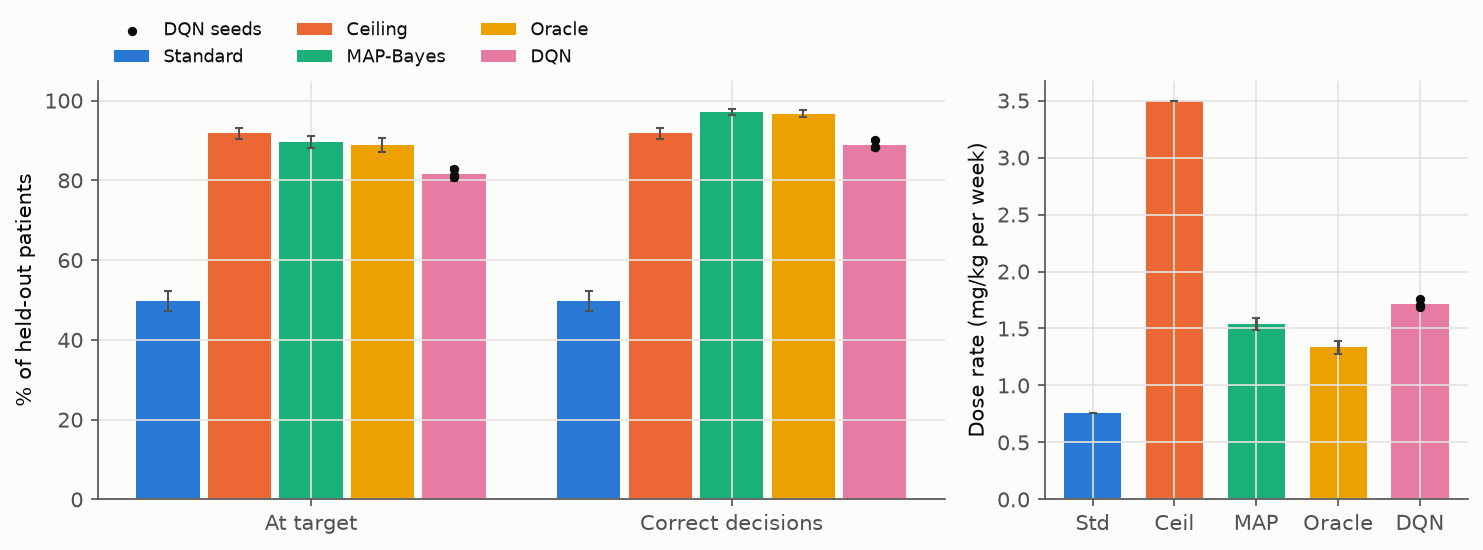
DQN at target
81.6%
95% CI 79.8 to 83.4, mean of 3 seeds
MAP-Bayes at target
89.7%
95% CI 88.1 to 91.1
DQN minus MAP-Bayes
−8.0 pts
at target, paired 95% CI −9.3 to −6.7
DQN minus standard regimen
+31.8 pts
at target, paired 95% CI +29.6 to +34.0
Reachable on the ceiling regimen
91.9%
of the 1,500 held-out patients

The decision problem

One episode is one virtual patient and 5 decisions. The chart shows the target part of the reward and the cost of stopping; it's shallow just above target, which matters for the misses below.

What it sees

16 numbers at each decision: the measured biomarker at baseline, at the previous visit and now, the measured trough concentration (with a flag when it's below the LLOQ of 0.5 mg/L), the last dose and interval, the induction dose, time since the first dose, the latest ADA result, and baseline weight, albumin, INF and PLT. It never sees the patient's true clearance, IC50 or baseline level, or whether the patient can reach target.

What it can do

At day 0 it picks the induction dose, one of 6 doses from 2.5 to 15 mg/kg, given at days 0, 21, 42. From day 98 it makes 4 maintenance decisions. Each is one of 24 regimens (6 doses times intervals of 4, 6, 8, 10 weeks), or stopping Drug X and moving the patient to another treatment. Stopping isn't allowed at the induction decision.

The reward

After each interval it loses one point for each doubling of the true biomarker above 200 units (capped at 3) plus 0.05 per mg/kg per week of drug. Stopping ends the episode and costs 0.35 for each maintenance decision left. Discount factor 0.97.

This chart needs JavaScript and plotly.js.
One change from the shared Drug X model: the typical IC50 here is 10 mg/L instead of 3. The shared value is kept as a sensitivity run.

Policies on the same held-out patients

1,500 virtual patients per scenario. Bars show 95% bootstrap CIs over patients. The DQN bar averages the training seeds and the dots are the single seeds.

Horizontal bar chart of the chosen endpoint by policy

Paired differences

Each row is the first policy minus the second on the same patients, with a paired bootstrap 95% CI. Left of zero means the first policy scored lower.

This chart needs JavaScript and plotly.js.
Outcome against drug use

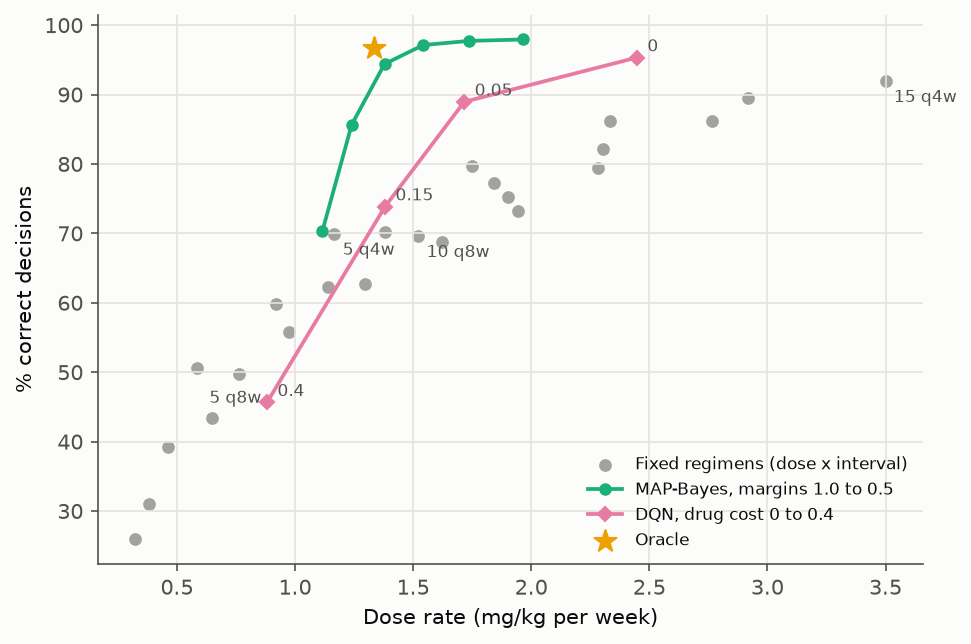
Gray points are the 24 fixed regimens (the same dose for induction and maintenance, never stopping). The MAP-Bayes line runs over its safety margin from 1 to 0.5, and the DQN line over the drug cost weight λ in its reward. Up and to the left is better. Drag to zoom, double-click to reset.

Scatter of correct decisions against dose rate

DQN by drug cost λ (held-out patients)

λAt targetCorrectStoppedDose rate (mg/kg/week)
089.5%95.3%6.2%2.45
0.05 (main, 3 seeds)81.6%89.0%9.2%1.72
0.1565.9%73.9%22.2%1.38
0.437.6%45.7%57.1%0.88
As λ rises the DQN saves drug mostly by stopping more patients, since the other treatment carries no drug cost in this reward. Static PNG

Learning curves

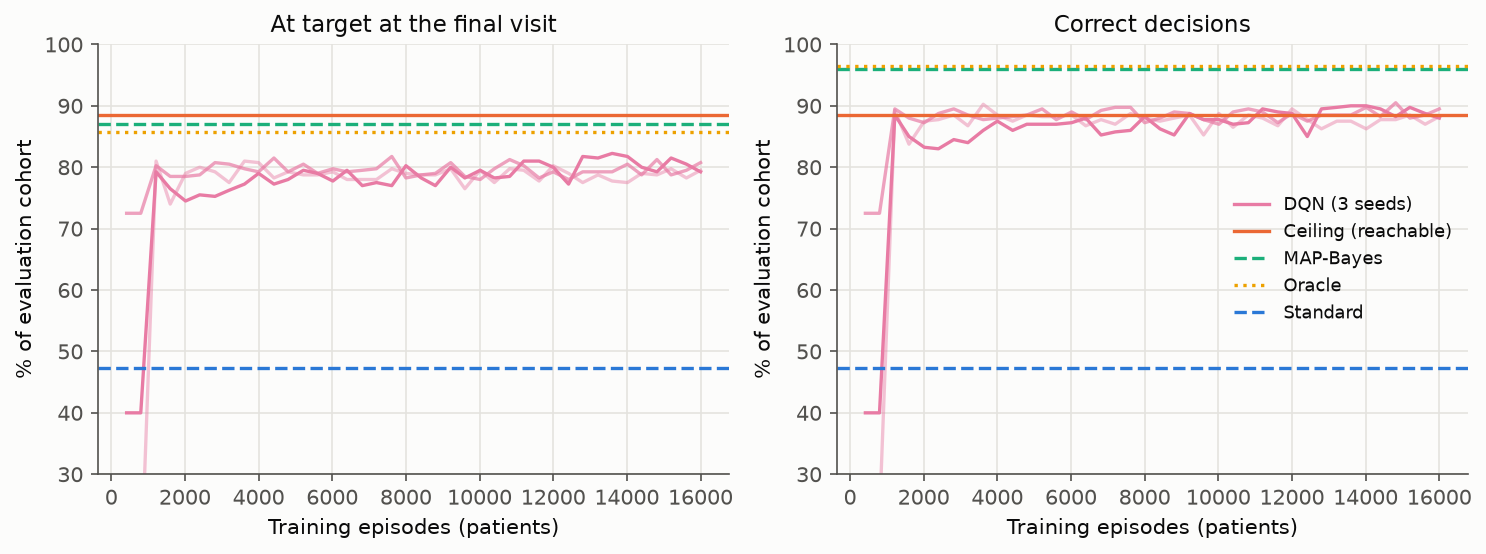
Each run is scored every 400 episodes on a fixed checkpoint cohort of training-profile patients, separate from the test patients. Straight lines are the other policies on that cohort (main settings only). Open circles mark the checkpoint kept, the one with the best mean return.

Line chart of DQN evaluation scores over training
The flare and shared-IC50 runs are scored on their own settings, so the reference lines don't apply to them. Static PNG

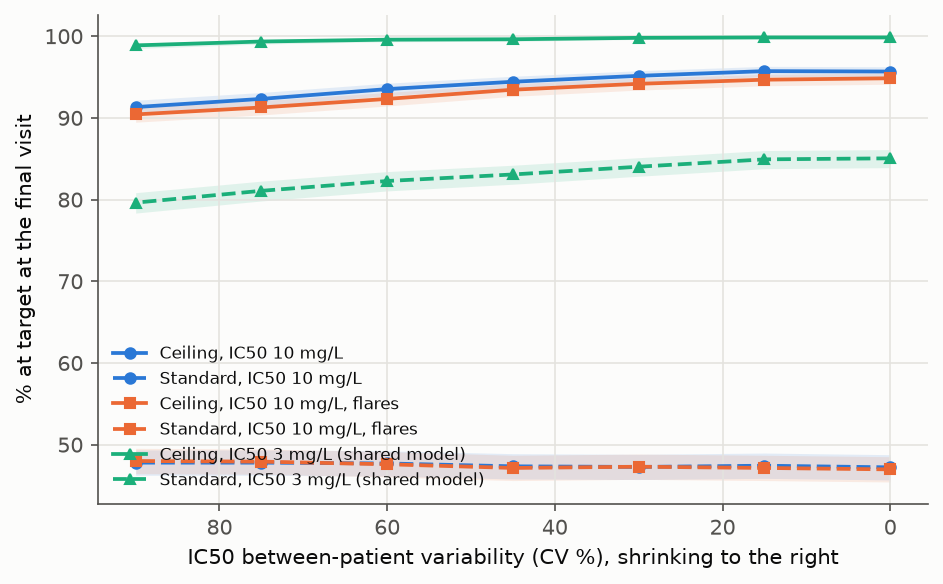
Reachability as IC50 variability shrinks

4,000 new patients, changing only the IC50 variance and keeping every other random draw fixed. A patient is reachable if the ceiling regimen gets the true biomarker below target at the final visit, so the ceiling line is the share reachable. Bands are 95% CIs. Click the legend to hide a line.

Share at target on the ceiling and standard regimens against IC50 variability

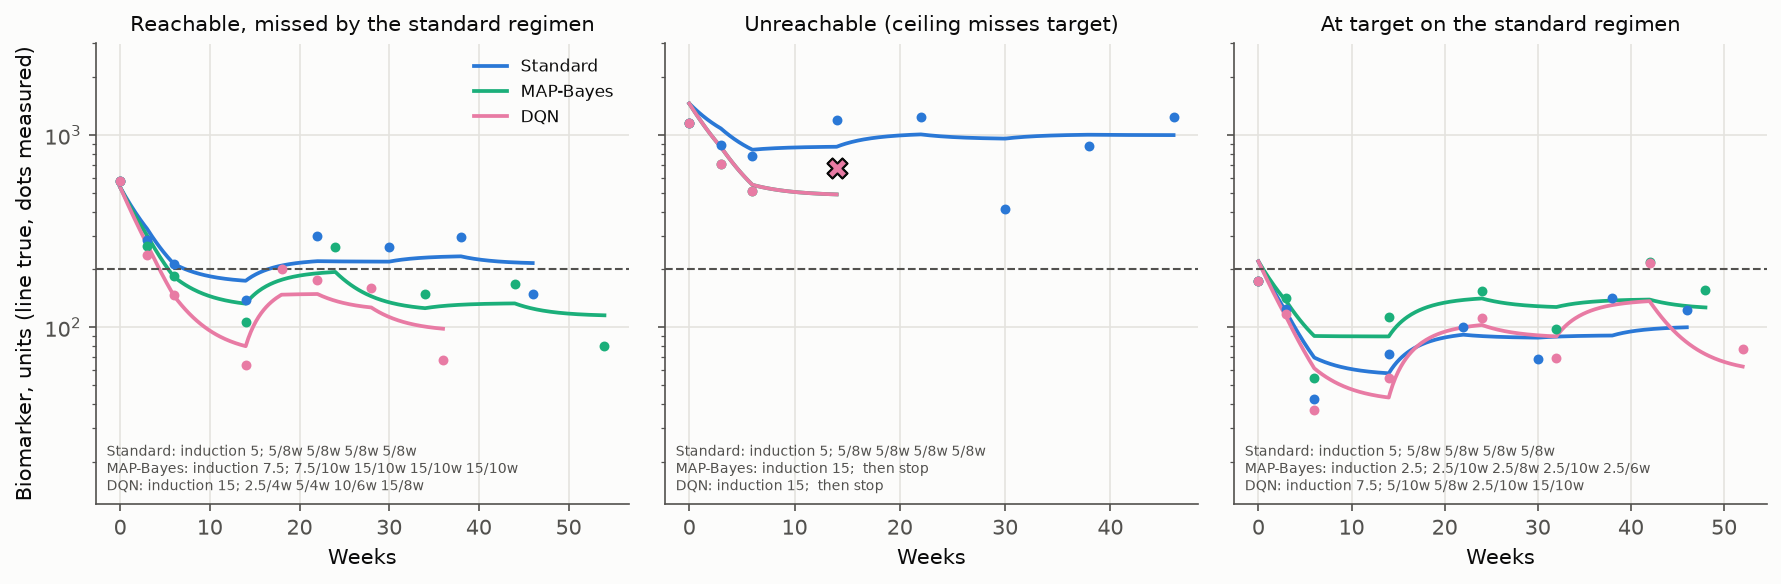
Example patients

Lines are the true biomarker, dots the value measured at each visit, and an X marks where a policy stopped Drug X. The lower panel shows each dose. Click a policy in the legend to hide it.

Biomarker and dose over time for one patient under three policies
  • Standard: induction 5 mg/kg, then 5 mg/kg every 8 weeks; 5 mg/kg every 8 weeks; 5 mg/kg every 8 weeks; 5 mg/kg every 8 weeks. Last true biomarker 216.
  • MAP-Bayes: induction 7.5 mg/kg, then 7.5 mg/kg every 10 weeks; 15 mg/kg every 10 weeks; 15 mg/kg every 10 weeks; 15 mg/kg every 10 weeks. Last true biomarker 115.
  • DQN (seed 0): induction 15 mg/kg, then 2.5 mg/kg every 4 weeks; 5 mg/kg every 4 weeks; 10 mg/kg every 6 weeks; 15 mg/kg every 8 weeks. Last true biomarker 98.

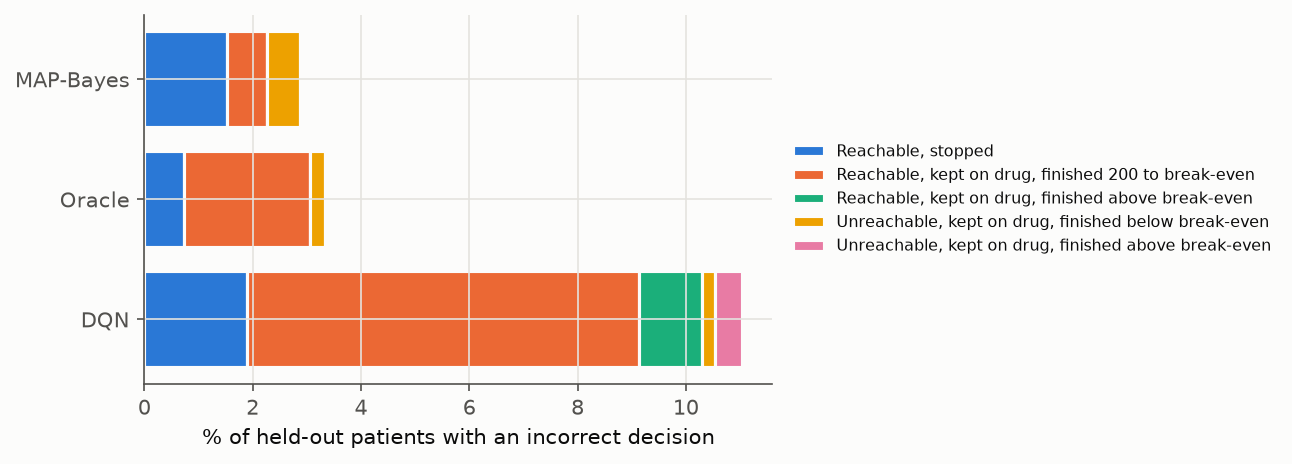
Misses

An incorrect decision is a reachable patient who doesn't finish at target, or an unreachable patient kept on Drug X. The break-even level, 255 units, is where stopping and staying on the drug cost the same. Out of 1,500 held-out patients; the DQN counts are averaged over seeds.

Stacked bars of the kinds of incorrect decision by policy

Number of patients

Kind of missMAP-BayesOracleDQNStandard
Reachable, stopped231128.30
Reachable, kept on drug, finished 200 to 2551135108.7176
Reachable, kept on drug, finished above 2550017.3456
Unreachable, kept on drug, finished below 255943.70
Unreachable, kept on drug, finished above 255007.7121
Total4350165.7753

Where reachable patients finish

Final true biomarker for reachable patients kept on Drug X, as a share of all patients on each policy. Mass to the right of the target line is a miss. The ceiling regimen is hidden; click it in the legend to show it.

This chart needs JavaScript and plotly.js.
Scenarios

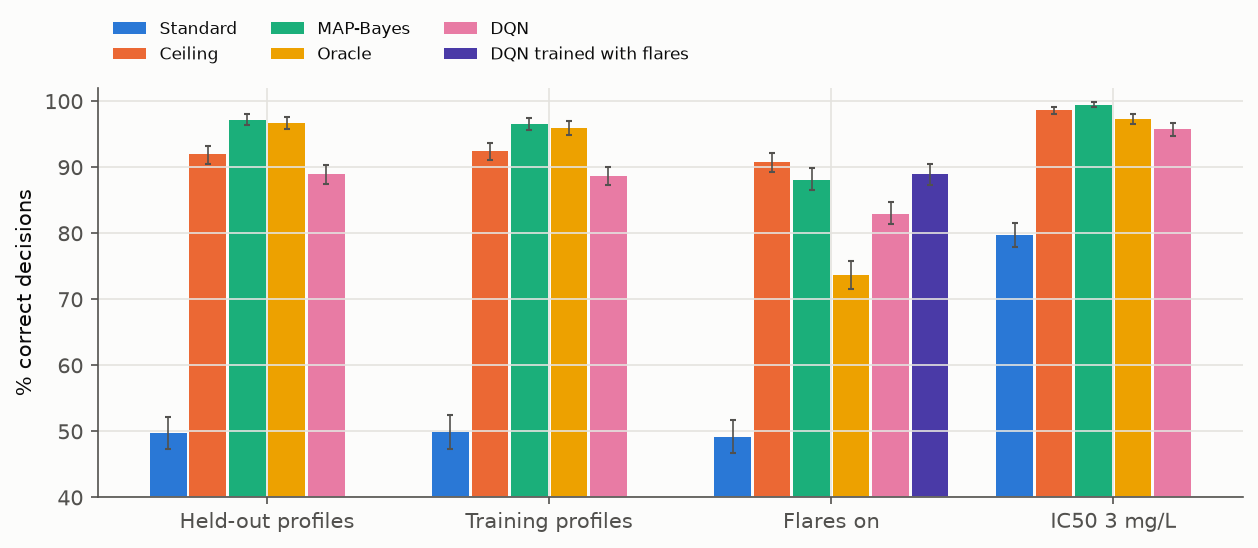
Held-out profiles are the main test. Training profiles reuse covariate profiles seen in training with new random effects. Flares add between-occasion variability on the baseline biomarker. The shared-IC50 run uses a DQN trained in that setting (1 seed), and the flare-trained DQN is one seed.

Grouped bars of the chosen endpoint by scenario and policy

At target / correct decisions (%)

ScenarioReachableStandardMAP-BayesOracleDQNDQN trained with flares
Held-out profiles (main)91.9%49.8 / 49.889.7 / 97.188.9 / 96.781.6 / 89.0
Training profiles, new random effects92.4%49.9 / 49.989.7 / 96.688.7 / 96.081.8 / 88.7
Flares on90.7%49.1 / 49.180.0 / 88.166.1 / 73.775.0 / 82.980.7 / 88.9
IC50 3 mg/L (shared model)98.6%79.7 / 79.798.3 / 99.596.0 / 97.394.5 / 95.7

All endpoints

Point estimates with 95% CIs. Dose rate is mg/kg per week. Cave CV is the between-patient CV of the average concentration in the last interval. Weeks to sustained target only counts patients who get there. Click a column header to sort.

PolicySeedsAt target %Correct %Stopped %Dose rateCave CV %Weeks to targetMean returnADA+ at end %Induction mg/kg
Standard149.8 (47.3 to 52.2)49.8 (47.3 to 52.2)0.0 (0.0 to 0.0)0.76 (0.76 to 0.76)53.1 (51.1 to 55.0)7.2 (6.5 to 7.8)−2.40 (−2.57 to −2.24)26.15.0
Ceiling191.9 (90.5 to 93.2)91.9 (90.5 to 93.2)0.0 (0.0 to 0.0)3.50 (3.50 to 3.50)43.3 (41.5 to 45.2)7.8 (7.5 to 8.1)−1.30 (−1.38 to −1.23)9.015.0
MAP-Bayes189.7 (88.1 to 91.1)97.1 (96.3 to 98.0)9.0 (7.6 to 10.5)1.54 (1.49 to 1.59)110.1 (105.9 to 114.3)10.9 (10.4 to 11.4)−0.66 (−0.70 to −0.61)21.58.4
Oracle188.9 (87.2 to 90.5)96.7 (95.8 to 97.6)8.5 (7.2 to 10.1)1.33 (1.28 to 1.39)109.2 (104.6 to 113.8)11.4 (10.9 to 11.9)−0.52 (−0.56 to −0.48)24.27.4
DQN381.6 (79.8 to 83.4)89.0 (87.5 to 90.3)9.2 (7.8 to 10.6)1.72 (1.68 to 1.76)74.1 (71.6 to 76.7)9.1 (8.7 to 9.5)−0.70 (−0.74 to −0.66)18.410.4
DQN seed 0181.3 (79.3 to 83.3)88.4 (86.7 to 90.0)8.8 (7.3 to 10.3)1.76 (1.72 to 1.80)79.2 (76.2 to 82.0)9.1 (8.5 to 9.6)−0.69 (−0.73 to −0.65)19.511.2
DQN seed 1182.8 (80.9 to 84.7)90.1 (88.6 to 91.6)9.2 (7.7 to 10.7)1.71 (1.66 to 1.75)73.0 (69.5 to 76.7)9.3 (8.8 to 9.7)−0.69 (−0.73 to −0.65)18.810.3
DQN seed 2180.9 (78.7 to 83.0)88.3 (86.7 to 90.0)9.6 (8.1 to 11.1)1.69 (1.65 to 1.72)70.1 (67.2 to 73.0)9.0 (8.6 to 9.5)−0.72 (−0.76 to −0.67)16.99.7

Margin tuning for MAP-Bayes and the oracle

Both rules pick the cheapest regimen predicted to land below a margin times the target. Each column is the mean return on the DQN's checkpoint cohort, so every adaptive policy is tuned on the same patients. The margin with the best return was used.

MarginMAP-Bayes, main settingsOracle, main settingsMAP-Bayes, IC50 3 mg/LOracle, IC50 3 mg/L
1−0.890−0.580−0.477−0.215
0.9−0.767−0.553 (used)−0.385−0.184 (used)
0.8−0.716−0.578−0.323−0.196
0.7−0.705 (used)−0.616−0.296−0.217
0.6−0.714−0.661−0.292 (used)−0.246
0.5−0.753−0.718−0.305−0.284